## Line Chart: Gemini-2.0-Flash Performance
### Overview
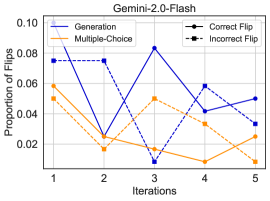
This image presents a line chart illustrating the "Proportion of Flips" across five "Iterations" for different evaluation methods related to the Gemini-2.0-Flash model. The evaluation methods are "Generation", "Multiple-Choice", "Correct Flip", and "Incorrect Flip". The chart aims to show how the proportion of flips changes with each iteration for each method.
### Components/Axes
* **Title:** Gemini-2.0-Flash (positioned at the top-center)
* **X-axis:** Iterations (labeled at the bottom, ranging from 1 to 5)
* **Y-axis:** Proportion of Flips (labeled on the left, ranging from 0.00 to 0.10, with increments of 0.02)
* **Legend:** Located at the top-right corner, containing the following labels and corresponding colors:
* Generation (Blue) - Solid Line
* Multiple-Choice (Orange) - Solid Line
* Correct Flip (Black) - Dashed-Dot Line
* Incorrect Flip (Blue Dashed) - Dashed Line
### Detailed Analysis
Let's analyze each data series individually:
* **Generation (Blue Solid Line):** This line exhibits a fluctuating trend. It starts at approximately 0.065, decreases to a minimum of approximately 0.01 at iteration 3, and then increases to approximately 0.055 at iteration 5.
* Iteration 1: ~0.065
* Iteration 2: ~0.03
* Iteration 3: ~0.01
* Iteration 4: ~0.05
* Iteration 5: ~0.055
* **Multiple-Choice (Orange Solid Line):** This line generally decreases over the iterations. It begins at approximately 0.06, reaches a minimum of approximately 0.015 at iteration 3, and then slightly increases to approximately 0.025 at iteration 5.
* Iteration 1: ~0.06
* Iteration 2: ~0.02
* Iteration 3: ~0.015
* Iteration 4: ~0.01
* Iteration 5: ~0.025
* **Correct Flip (Black Dashed-Dot Line):** This line starts at approximately 0.08, decreases to approximately 0.04 at iteration 2, then fluctuates around 0.04-0.05 before decreasing to approximately 0.03 at iteration 5.
* Iteration 1: ~0.08
* Iteration 2: ~0.04
* Iteration 3: ~0.05
* Iteration 4: ~0.04
* Iteration 5: ~0.03
* **Incorrect Flip (Blue Dashed Line):** This line starts at approximately 0.075, decreases to approximately 0.03 at iteration 2, increases to approximately 0.04 at iteration 4, and then decreases to approximately 0.025 at iteration 5.
* Iteration 1: ~0.075
* Iteration 2: ~0.03
* Iteration 3: ~0.035
* Iteration 4: ~0.04
* Iteration 5: ~0.025
### Key Observations
* The "Generation" and "Multiple-Choice" methods show a decreasing trend in the proportion of flips over the iterations, suggesting potential improvement or convergence.
* The "Correct Flip" and "Incorrect Flip" methods exhibit more stable behavior, with fluctuations around a consistent level.
* The "Generation" method has the most significant drop in the proportion of flips between iterations 1 and 3.
* The "Multiple-Choice" method consistently has a lower proportion of flips compared to the "Correct Flip" and "Incorrect Flip" methods.
### Interpretation
The chart suggests that the Gemini-2.0-Flash model is improving in its "Generation" and "Multiple-Choice" performance as the iterations progress, as indicated by the decreasing proportion of flips. "Flips" likely refer to changes in the model's output or predictions. A lower proportion of flips suggests greater stability and consistency in the model's responses. The relatively stable "Correct Flip" and "Incorrect Flip" proportions might indicate that the model's ability to identify correct and incorrect answers remains consistent throughout the iterations. The difference between the "Correct Flip" and "Incorrect Flip" proportions could be a measure of the model's accuracy. The initial high value for "Correct Flip" suggests a baseline level of correct identification, while the "Incorrect Flip" proportion indicates the frequency of errors. The fluctuations in all lines could be due to the stochastic nature of the training process or the inherent variability in the evaluation data. The data suggests that the model is learning and refining its responses over time, particularly in the "Generation" and "Multiple-Choice" tasks.