## Line Chart: Gemini-2.0-Flip Proportions Over Iterations
### Overview
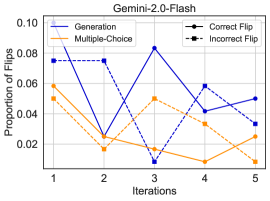
This is a line chart titled "Gemini-2.0-Flash" that plots the "Proportion of Flips" against "Iterations" (1 through 5). It compares four distinct data series, differentiated by line style, color, and marker shape, representing different conditions or outcomes related to a "flip" event.
### Components/Axes
* **Chart Title:** "Gemini-2.0-Flash" (centered at the top).
* **X-Axis:** Labeled "Iterations". It has five discrete, equally spaced tick marks labeled 1, 2, 3, 4, and 5.
* **Y-Axis:** Labeled "Proportion of Flips". The scale runs from 0.00 to 0.10, with major tick marks at intervals of 0.02 (0.00, 0.02, 0.04, 0.06, 0.08, 0.10).
* **Legend:** Located in the top-right corner of the plot area. It defines four series:
1. **Generation:** Solid blue line.
2. **Multiple-Choice:** Solid orange line.
3. **Correct Flip:** Dashed blue line with circular markers (●).
4. **Incorrect Flip:** Dashed orange line with square markers (■).
### Detailed Analysis
The following data points are approximate values extracted from the chart. The trend for each series is described first, followed by the estimated values per iteration.
**1. Generation (Solid Blue Line)**
* **Trend:** Shows high variability. It starts high, dips sharply at iteration 2, peaks at iteration 3, then declines before a slight rise at iteration 5.
* **Data Points (Approximate):**
* Iteration 1: 0.078
* Iteration 2: 0.025
* Iteration 3: 0.082
* Iteration 4: 0.045
* Iteration 5: 0.050
**2. Multiple-Choice (Solid Orange Line)**
* **Trend:** Shows a general downward trend with a small peak at iteration 3. It is consistently lower than the "Generation" line except at iteration 2.
* **Data Points (Approximate):**
* Iteration 1: 0.055
* Iteration 2: 0.018
* Iteration 3: 0.050
* Iteration 4: 0.010
* Iteration 5: 0.025
**3. Correct Flip (Dashed Blue Line with ● Markers)**
* **Trend:** Follows a pattern very similar to the "Generation" line, suggesting a strong correlation. It starts high, dips at iteration 2, peaks at iteration 3, then declines.
* **Data Points (Approximate):**
* Iteration 1: 0.075
* Iteration 2: 0.078
* Iteration 3: 0.010
* Iteration 4: 0.058
* Iteration 5: 0.035
**4. Incorrect Flip (Dashed Orange Line with ■ Markers)**
* **Trend:** Remains relatively low and stable across all iterations, with a slight peak at iteration 3. It is consistently the lowest or second-lowest series.
* **Data Points (Approximate):**
* Iteration 1: 0.048
* Iteration 2: 0.020
* Iteration 3: 0.030
* Iteration 4: 0.018
* Iteration 5: 0.015
### Key Observations
1. **Iteration 3 is a Critical Point:** All four series show a significant change at iteration 3. "Generation" and "Correct Flip" reach their maximum values, while "Multiple-Choice" shows its only notable peak. "Incorrect Flip" also has a minor peak here.
2. **Strong Correlation:** The "Generation" (solid blue) and "Correct Flip" (dashed blue) lines track each other closely in shape, though their absolute values differ at iterations 2 and 3.
3. **Divergence at Iteration 2:** At iteration 2, the "Correct Flip" proportion remains high (~0.078) while the "Generation" proportion drops sharply (~0.025). This is the most significant point of divergence between these two correlated series.
4. **Low Incorrect Flip Rate:** The "Incorrect Flip" series is consistently the lowest or near-lowest, indicating that the proportion of incorrect flips is generally small compared to other measured proportions.
### Interpretation
The chart appears to analyze the performance or behavior of a system named "Gemini-2.0-Flash" over five iterative steps. The data suggests a comparison between two primary methods or conditions: "Generation" and "Multiple-Choice."
* The "Generation" method exhibits higher volatility and achieves higher peak proportions of flips, particularly at iteration 3. Its strong correlation with the "Correct Flip" series implies that a significant portion of the flips occurring under the "Generation" condition are correct.
* The "Multiple-Choice" method shows a more stable, generally declining trend, suggesting it may be a more conservative or consistent approach that yields fewer flips overall.
* The "Correct Flip" and "Incorrect Flip" series likely represent a breakdown of the outcomes from the "Generation" and/or "Multiple-Choice" processes. The fact that "Correct Flip" peaks dramatically at iteration 3 while "Incorrect Flip" only has a minor peak suggests that iteration 3 was a particularly successful step for generating correct outcomes, not just more outcomes in general.
* The anomaly at iteration 2—where "Correct Flip" stays high but "Generation" drops—could indicate that while the overall generation rate fell, the *accuracy* (proportion of correct flips within that generation) was exceptionally high for that step.
In summary, the data demonstrates that the "Generation" approach is more dynamic and can lead to high rates of correct flips, especially at a specific iteration (3), while the "Multiple-Choice" approach is more subdued. The system's performance is not linear across iterations, with iteration 3 being a clear focal point of activity.