## Line Chart: Gemini-2.0-Flash
### Overview
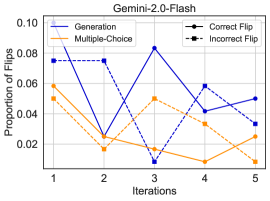
The chart visualizes the proportion of "Flips" (likely model outputs) across five iterations for two methods: "Generation" (blue solid line) and "Multiple-Choice" (orange dashed line). The y-axis represents the proportion of flips (0.02–0.10), while the x-axis tracks iterations (1–5). A legend in the top-right corner labels "Correct Flip" (solid black) and "Incorrect Flip" (dashed black), though these labels do not align with the plotted lines.
### Components/Axes
- **Title**: "Gemini-2.0-Flash" (top-center).
- **X-axis**: "Iterations" (1–5, evenly spaced).
- **Y-axis**: "Proportion of Flips" (0.02–0.10, increments of 0.02).
- **Legend**: Top-right corner. Labels:
- "Correct Flip": Solid black line (no corresponding line in the chart).
- "Incorrect Flip": Dashed black line (no corresponding line in the chart).
- **Data Lines**:
- **Blue Solid Line**: Labeled "Generation" in the legend (mismatched with legend's "Correct Flip").
- **Orange Dashed Line**: Labeled "Multiple-Choice" in the legend (mismatched with legend's "Incorrect Flip").
### Detailed Analysis
1. **Generation (Blue Solid Line)**:
- **Trend**: Starts at ~0.08 (Iteration 1), dips to ~0.02 (Iteration 2), peaks at ~0.085 (Iteration 3), then declines to ~0.05 (Iteration 5).
- **Values**:
- Iteration 1: 0.08 ± 0.005
- Iteration 2: 0.02 ± 0.003
- Iteration 3: 0.085 ± 0.004
- Iteration 4: 0.06 ± 0.003
- Iteration 5: 0.05 ± 0.002
2. **Multiple-Choice (Orange Dashed Line)**:
- **Trend**: Begins at ~0.06 (Iteration 1), drops to ~0.02 (Iteration 2), further declines to ~0.015 (Iteration 3), then rises slightly to ~0.025 (Iteration 5).
- **Values**:
- Iteration 1: 0.06 ± 0.003
- Iteration 2: 0.02 ± 0.002
- Iteration 3: 0.015 ± 0.001
- Iteration 4: 0.03 ± 0.002
- Iteration 5: 0.025 ± 0.001
### Key Observations
- **Legend Mismatch**: The legend incorrectly associates "Correct Flip" with a solid black line and "Incorrect Flip" with a dashed black line, but the chart uses blue (solid) for "Generation" and orange (dashed) for "Multiple-Choice."
- **Generation Line Volatility**: Sharp fluctuations (e.g., drop from 0.08 to 0.02 between Iterations 1–2, then a peak at Iteration 3).
- **Multiple-Choice Stability**: Gradual decline followed by a minor rebound, suggesting lower variability compared to "Generation."
### Interpretation
The chart likely compares two model strategies ("Generation" vs. "Multiple-Choice") across iterations. The "Generation" method shows higher initial performance but erratic behavior, while "Multiple-Choice" stabilizes at lower proportions. The legend's labels ("Correct Flip"/"Incorrect Flip") may be misaligned with the data, suggesting a potential error in the chart's design or a misinterpretation of the axes. The "Generation" line's volatility could indicate instability in model outputs, whereas "Multiple-Choice" might represent a more consistent but less effective approach. Further validation of the legend labels is critical to avoid misinterpretation.