## Chart Type: Multiple Line Charts Comparing Cross-Entropy (CE) Loss
### Overview
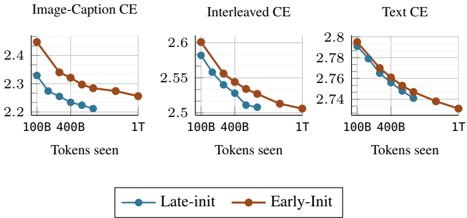
The image presents three line charts comparing the cross-entropy (CE) loss for different training strategies: "Image-Caption CE", "Interleaved CE", and "Text CE". Each chart plots the CE loss against the number of tokens seen during training, comparing "Late-init" and "Early-Init" approaches.
### Components/Axes
* **Titles (Top):**
* Left: "Image-Caption CE"
* Middle: "Interleaved CE"
* Right: "Text CE"
* **X-axis (Horizontal):** "Tokens seen" with markers at "100B", "400B", and "1T" (Trillion).
* **Y-axis (Vertical):** Cross-Entropy (CE) Loss. The scales vary slightly between charts:
* Image-Caption CE: Ranges from approximately 2.2 to 2.45.
* Interleaved CE: Ranges from approximately 2.5 to 2.6.
* Text CE: Ranges from approximately 2.74 to 2.8.
* **Legend (Bottom):**
* Blue line with circle markers: "Late-init"
* Brown line with circle markers: "Early-Init"
### Detailed Analysis
**1. Image-Caption CE**
* **Late-init (Blue):** The line slopes downward, indicating decreasing CE loss as more tokens are seen.
* 100B Tokens: CE loss ≈ 2.33
* 400B Tokens: CE loss ≈ 2.25
* 1T Tokens: CE loss ≈ 2.22
* **Early-Init (Brown):** The line also slopes downward.
* 100B Tokens: CE loss ≈ 2.45
* 400B Tokens: CE loss ≈ 2.33
* 1T Tokens: CE loss ≈ 2.26
**2. Interleaved CE**
* **Late-init (Blue):** The line slopes downward.
* 100B Tokens: CE loss ≈ 2.57
* 400B Tokens: CE loss ≈ 2.52
* 1T Tokens: CE loss ≈ 2.50
* **Early-Init (Brown):** The line slopes downward.
* 100B Tokens: CE loss ≈ 2.60
* 400B Tokens: CE loss ≈ 2.54
* 1T Tokens: CE loss ≈ 2.51
**3. Text CE**
* **Late-init (Blue):** The line slopes downward.
* 100B Tokens: CE loss ≈ 2.79
* 400B Tokens: CE loss ≈ 2.75
* 1T Tokens: CE loss ≈ 2.74
* **Early-Init (Brown):** The line slopes downward.
* 100B Tokens: CE loss ≈ 2.80
* 400B Tokens: CE loss ≈ 2.76
* 1T Tokens: CE loss ≈ 2.74
### Key Observations
* In all three charts, both "Late-init" and "Early-Init" strategies show a decrease in CE loss as the number of tokens seen increases.
* The "Early-Init" strategy generally starts with a higher CE loss than the "Late-init" strategy, but the difference diminishes as more tokens are seen.
* The "Text CE" chart has the highest CE loss values compared to the other two charts.
* The "Image-Caption CE" chart has the lowest CE loss values compared to the other two charts.
### Interpretation
The charts suggest that both "Late-init" and "Early-Init" strategies benefit from increased training data (more tokens seen), as indicated by the decreasing CE loss. The "Early-Init" strategy might initially perform worse, but the performance gap narrows with more training. The different CE loss values across the three charts ("Image-Caption CE", "Interleaved CE", and "Text CE") likely reflect the inherent difficulty or characteristics of each training task. The "Text CE" task appears to be the most challenging, while "Image-Caption CE" is the least, based on the relative CE loss values.