## Line Charts: Training Loss vs. Tokens Seen for Different Initialization Strategies
### Overview
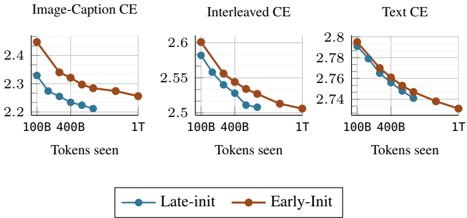
The image presents three separate line charts, each depicting the relationship between a loss metric (CE - Cross-Entropy) and the number of tokens seen during training. Each chart corresponds to a different training condition: "Image-Caption CE", "Interleaved CE", and "Text CE". Within each chart, two lines represent different initialization strategies: "Late-init" (blue) and "Early-Init" (brown). The x-axis represents the number of tokens seen, with markers at 100B, 400B, and 1T (1 Trillion). The y-axis represents the CE loss value.
### Components/Axes
* **X-axis Title (all charts):** "Tokens seen"
* **X-axis Markers (all charts):** 100B, 400B, 1T
* **Y-axis Titles:**
* "Image-Caption CE" chart: CE loss (approximately 2.2 to 2.5)
* "Interleaved CE" chart: CE loss (approximately 2.5 to 2.7)
* "Text CE" chart: CE loss (approximately 2.7 to 2.85)
* **Legend (bottom-center):**
* "Late-init" - Blue line with circular markers
* "Early-Init" - Brown line with circular markers
### Detailed Analysis or Content Details
**Image-Caption CE Chart:**
* The "Early-Init" line (brown) starts at approximately 2.48 at 100B tokens, decreases to approximately 2.32 at 400B tokens, and then to approximately 2.28 at 1T tokens. This line shows a decreasing trend.
* The "Late-init" line (blue) starts at approximately 2.33 at 100B tokens, decreases to approximately 2.25 at 400B tokens, and then to approximately 2.23 at 1T tokens. This line also shows a decreasing trend, and remains below the "Early-Init" line throughout.
**Interleaved CE Chart:**
* The "Early-Init" line (brown) starts at approximately 2.63 at 100B tokens, decreases to approximately 2.55 at 400B tokens, and then to approximately 2.51 at 1T tokens. This line shows a decreasing trend.
* The "Late-init" line (blue) starts at approximately 2.58 at 100B tokens, decreases to approximately 2.52 at 400B tokens, and then to approximately 2.50 at 1T tokens. This line also shows a decreasing trend, and remains below the "Early-Init" line throughout.
**Text CE Chart:**
* The "Early-Init" line (brown) starts at approximately 2.82 at 100B tokens, decreases to approximately 2.76 at 400B tokens, and then to approximately 2.73 at 1T tokens. This line shows a decreasing trend.
* The "Late-init" line (blue) starts at approximately 2.80 at 100B tokens, decreases to approximately 2.75 at 400B tokens, and then to approximately 2.73 at 1T tokens. This line also shows a decreasing trend, and remains below the "Early-Init" line throughout.
### Key Observations
* In all three charts, both "Early-Init" and "Late-init" lines exhibit a decreasing trend as the number of tokens seen increases, indicating that the loss is decreasing with more training data.
* The "Late-init" strategy consistently achieves lower loss values than the "Early-Init" strategy across all three training conditions.
* The rate of loss decrease appears to slow down as the number of tokens seen increases, suggesting diminishing returns from further training.
* The "Image-Caption CE" chart has the lowest overall loss values, while the "Text CE" chart has the highest.
### Interpretation
The data suggests that the "Late-init" initialization strategy is more effective than the "Early-Init" strategy for all three training conditions ("Image-Caption", "Interleaved", and "Text"). The consistently lower loss values achieved by "Late-init" indicate that it leads to better model performance. The decreasing loss curves across all conditions demonstrate that the models are learning and improving with more training data. The differences in loss values between the three training conditions suggest that the type of training data (image-caption pairs, interleaved data, or text only) impacts the difficulty of the learning task. The "Text CE" condition appears to be the most challenging, as it consistently exhibits the highest loss values. The slowing rate of loss decrease at higher token counts suggests that the models are approaching convergence and that further training may yield only marginal improvements. This data could be used to inform decisions about initialization strategies and training data selection for similar models.