## Line Charts: Cross-Entropy Loss by Training Tokens and Initialization Method
### Overview
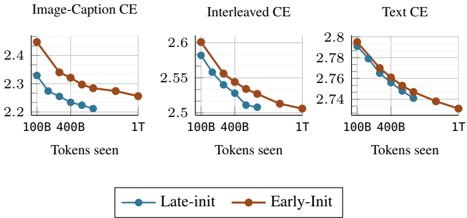
The image displays three horizontally arranged line charts comparing the performance of two model initialization methods ("Late-init" and "Early-Init") across three different training data types. Each chart plots the cross-entropy (CE) loss against the number of training tokens processed. The overall trend for all series is a decreasing loss as training progresses.
### Components/Axes
* **Titles (Top of each chart, left to right):**
1. `Image-Caption CE`
2. `Interleaved CE`
3. `Text CE`
* **X-Axis (Common to all charts):**
* Label: `Tokens seen`
* Tick Markers: `100B`, `400B`, `1T` (where B = Billion, T = Trillion).
* **Y-Axis (Scale varies per chart):**
1. **Image-Caption CE:** Linear scale from `2.2` to `2.4`.
2. **Interleaved CE:** Linear scale from `2.5` to `2.6`.
3. **Text CE:** Linear scale from `2.74` to `2.8`.
* **Legend (Bottom-center of the image):**
* `Late-init`: Represented by a blue line with circular markers.
* `Early-Init`: Represented by an orange line with circular markers.
### Detailed Analysis
**Chart 1: Image-Caption CE**
* **Trend Verification:** Both lines slope downward, indicating decreasing loss with more training. The `Early-Init` (orange) line is consistently above the `Late-init` (blue) line.
* **Data Points (Approximate):**
* **Late-init (Blue):** Starts at ~2.35 (100B), drops to ~2.25 (400B), ends at ~2.20 (1T).
* **Early-Init (Orange):** Starts at ~2.45 (100B), drops to ~2.32 (400B), ends at ~2.25 (1T).
**Chart 2: Interleaved CE**
* **Trend Verification:** Both lines slope downward. The `Early-Init` (orange) line remains above the `Late-init` (blue) line throughout.
* **Data Points (Approximate):**
* **Late-init (Blue):** Starts at ~2.58 (100B), drops to ~2.53 (400B), ends at ~2.50 (1T).
* **Early-Init (Orange):** Starts at ~2.60 (100B), drops to ~2.55 (400B), ends at ~2.50 (1T).
**Chart 3: Text CE**
* **Trend Verification:** Both lines slope downward. The lines are much closer together here than in the other charts, converging at the final point.
* **Data Points (Approximate):**
* **Late-init (Blue):** Starts at ~2.79 (100B), drops to ~2.76 (400B), ends at ~2.74 (1T).
* **Early-Init (Orange):** Starts at ~2.80 (100B), drops to ~2.77 (400B), ends at ~2.74 (1T).
### Key Observations
1. **Consistent Performance Gap:** The `Late-init` method (blue) achieves a lower cross-entropy loss than the `Early-Init` method (orange) at nearly every measured point across all three data types.
2. **Convergence on Text Data:** In the "Text CE" chart, the performance gap between the two methods is minimal, and they appear to converge to the same loss value (~2.74) after 1 trillion tokens.
3. **Loss Magnitude:** The absolute loss values are highest for "Text CE" (~2.74-2.80), intermediate for "Interleaved CE" (~2.50-2.60), and lowest for "Image-Caption CE" (~2.20-2.45). This suggests the models find the text-only task the most challenging (highest loss) and the image-caption task the least challenging (lowest loss) under these evaluation conditions.
4. **Learning Rate:** The steepest drop in loss for all series occurs between 100B and 400B tokens, with the rate of improvement slowing between 400B and 1T tokens.
### Interpretation
This data suggests that the **Late-init** initialization strategy is more effective than **Early-Init** for minimizing cross-entropy loss during training on multimodal (Image-Caption, Interleaved) and unimodal (Text) data. The advantage is most pronounced on the multimodal tasks.
The convergence on the text-only task implies that with sufficient training (1T tokens), the choice of initialization method becomes less critical for pure language modeling performance. However, for tasks involving image-text integration, the initialization method has a lasting impact on model performance, with Late-init providing a clear and consistent benefit. The higher absolute loss on text data may indicate that the model architecture or training setup is inherently better suited to, or has more prior for, processing aligned image-text pairs than raw text sequences.