## Scatter Plot: Relationship Between Normalized Neuron Response and Docking Energy
### Overview
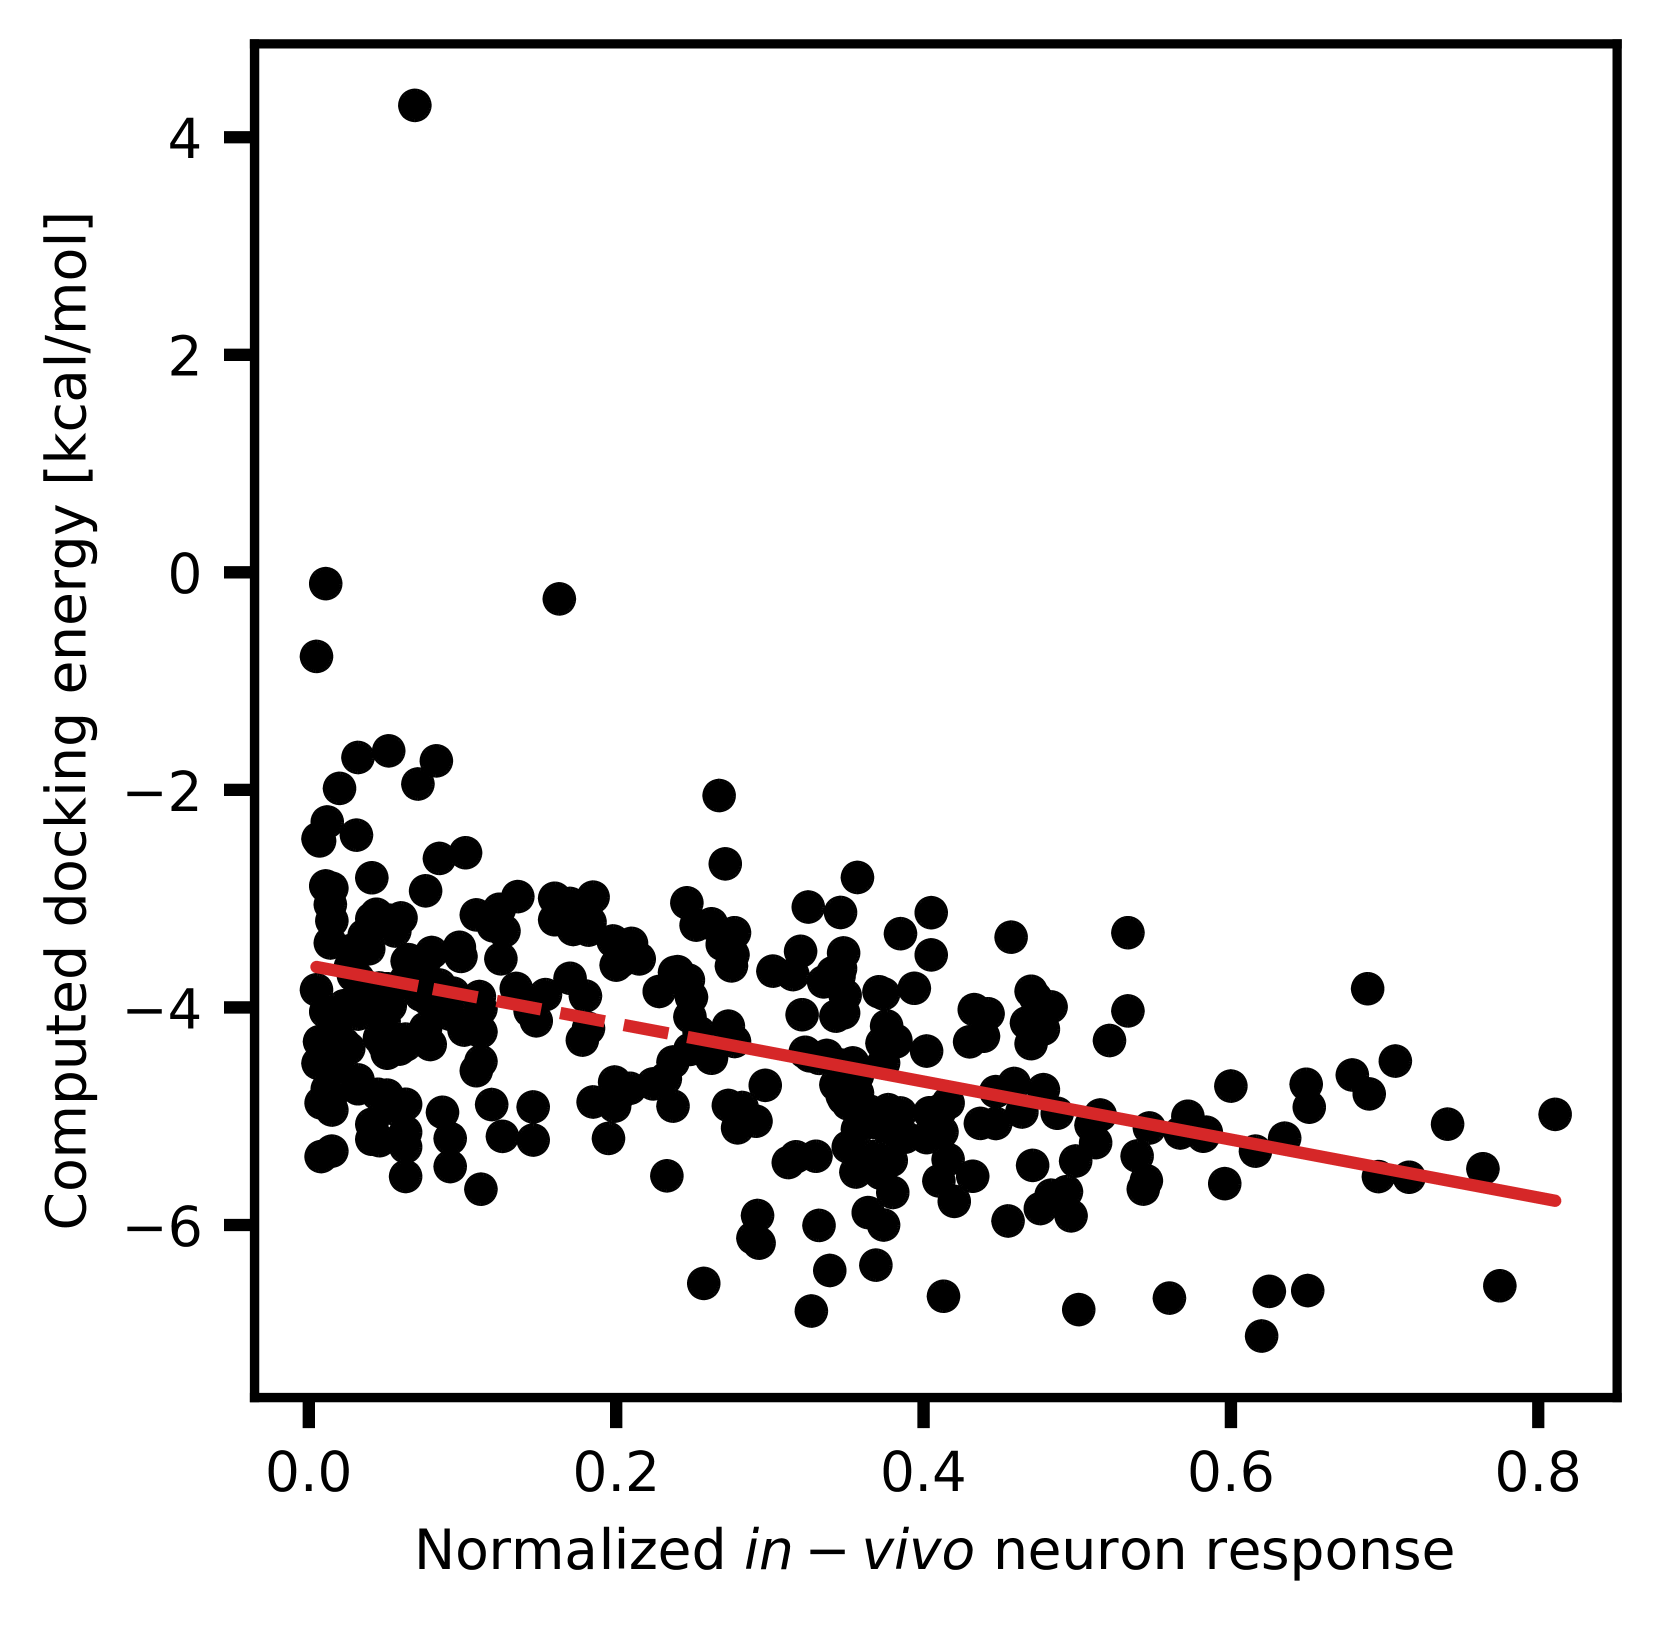
The image is a scatter plot visualizing the relationship between two variables: "Normalized in vivo neuron response" (x-axis) and "Computed docking energy [kcal/mol]" (y-axis). A red trend line is overlaid on the data points, indicating a general pattern. The plot contains approximately 100 black data points, with a few outliers.
---
### Components/Axes
- **X-axis**: "Normalized in vivo neuron response" (range: 0.0 to 0.8, labeled in increments of 0.2).
- **Y-axis**: "Computed docking energy [kcal/mol]" (range: -6 to 4, labeled in increments of 2).
- **Legend**: No explicit legend is present, but the red line is identified as a "trend line" based on its placement and color.
- **Data Points**: Black dots represent individual data points.
---
### Detailed Analysis
- **Data Distribution**:
- Most data points cluster around the red trend line, which slopes downward from left to right.
- The trend line suggests a negative correlation between the normalized neuron response and docking energy.
- Outliers include:
- A point at approximately (0.05, 4) (top-left).
- A cluster of points near (0.7, -5) to (0.8, -6) (bottom-right).
- The data points are densely packed in the lower-left quadrant (x ≈ 0.2 to 0.4, y ≈ -4 to -2).
- **Trend Line**:
- The red line has a negative slope, indicating that as the normalized neuron response increases, the computed docking energy decreases.
- The line passes through the center of the data distribution, suggesting a strong linear relationship.
---
### Key Observations
1. **Negative Correlation**: The trend line confirms a consistent inverse relationship between the two variables.
2. **Outliers**: A few data points deviate significantly from the trend line, particularly at the extremes of the x-axis.
3. **Data Spread**: The majority of points are concentrated in the range of x = 0.2 to 0.6 and y = -4 to -2, indicating a central tendency.
---
### Interpretation
The plot demonstrates that higher normalized neuron responses are associated with lower computed docking energies, suggesting a potential inhibitory or regulatory role of neuron activity on molecular docking processes. The trend line’s negative slope implies that as neuron response increases, the energy required for docking decreases, which could be critical for understanding biological mechanisms like signal transduction or drug-receptor interactions.
The outliers may represent experimental variability, measurement errors, or unique biological cases that deviate from the general trend. Further investigation into these points could reveal exceptions or alternative pathways.
The absence of a legend or explicit statistical annotations (e.g., R² value) limits the ability to quantify the strength of the correlation, but the visual trend is clear. This analysis highlights the importance of neuron response in modulating molecular interactions, with potential implications for computational biology and pharmacology.