## Line Graphs: Validation SRCC (MI) and Training Loss Over Epochs
### Overview
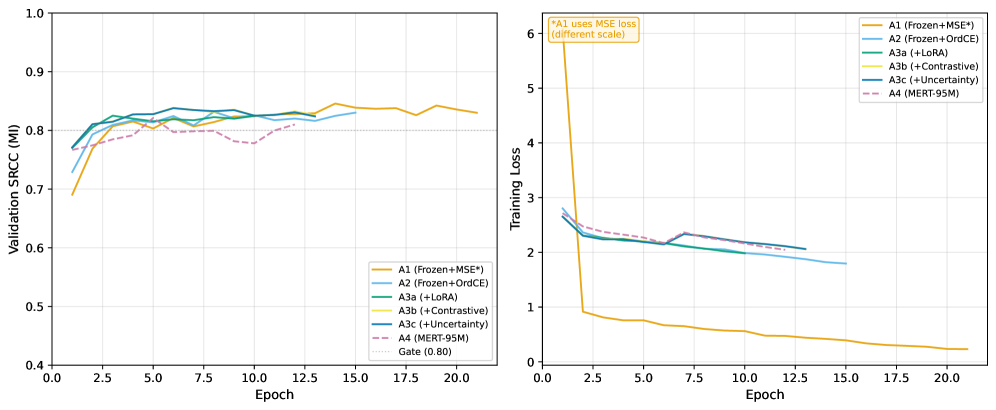
The image contains two line graphs comparing the performance of different model configurations (A1-A4) across training epochs. The left graph tracks **Validation SRCC (MI)** (Spearman Rank Correlation Coefficient) from 0.4 to 1.0, while the right graph tracks **Training Loss** from 0 to 6. Both graphs span 20 epochs (0–20) and include a reference line labeled "Gate (0.80)".
---
### Components/Axes
#### Left Graph (Validation SRCC)
- **X-axis**: Epoch (0–20, linear scale)
- **Y-axis**: Validation SRCC (MI) (0.4–1.0, linear scale)
- **Legend**:
- A1 (Frozen+MSE*): Orange
- A2 (Frozen+OrdCE): Blue
- A3a (+LoRA): Green
- A3b (+Contrastive): Yellow
- A3c (+Uncertainty): Dark Blue
- A4 (MERT-95M): Red (dashed)
- Gate (0.80): Gray dashed horizontal line
#### Right Graph (Training Loss)
- **X-axis**: Epoch (0–20, linear scale)
- **Y-axis**: Training Loss (0–6, linear scale)
- **Legend**: Same as left graph (colors match corresponding lines).
---
### Detailed Analysis
#### Left Graph (Validation SRCC)
- **A1 (Frozen+MSE*)**: Starts at ~0.75, peaks at ~0.85 (epoch 5), then fluctuates between 0.82–0.85.
- **A2 (Frozen+OrdCE)**: Similar to A1 but slightly lower, peaking at ~0.83 (epoch 5), then stabilizes near 0.82.
- **A3a (+LoRA)**: Peaks at ~0.84 (epoch 5), dips to ~0.81 (epoch 15), then recovers to ~0.83.
- **A3b (+Contrastive)**: Starts at ~0.78, rises to ~0.83 (epoch 5), then declines to ~0.81 (epoch 20).
- **A3c (+Uncertainty)**: Most stable, fluctuates between 0.82–0.84.
- **A4 (MERT-95M)**: Consistently lowest, hovering between 0.75–0.78.
- **Gate (0.80)**: Horizontal line at 0.80; all models except A4 exceed this threshold.
#### Right Graph (Training Loss)
- **A1 (Frozen+MSE*)**: Starts at ~6, drops sharply to ~0.5 (epoch 2), then plateaus at ~0.4.
- **A2 (Frozen+OrdCE)**: Starts at ~2.5, decreases gradually to ~1.8 (epoch 20).
- **A3a (+LoRA)**: Starts at ~2.2, decreases to ~1.9 (epoch 20).
- **A3b (+Contrastive)**: Starts at ~2.1, decreases to ~1.7 (epoch 20).
- **A3c (+Uncertainty)**: Starts at ~2.0, decreases to ~1.6 (epoch 20).
- **A4 (MERT-95M)**: Lowest, starts at ~0.8, decreases to ~0.3 (epoch 20).
- **Gate (0.80)**: Horizontal line at 0.80; only A4 remains below this threshold after epoch 5.
---
### Key Observations
1. **Validation Performance**:
- A1 and A2 achieve the highest SRCC, surpassing the Gate threshold (0.80) consistently.
- A4 underperforms, remaining below the Gate line.
2. **Training Loss**:
- A1 experiences a dramatic initial drop but stabilizes at a low loss (~0.4).
- A4 has the lowest training loss throughout, suggesting efficient learning.
3. **Divergence Between Metrics**:
- A1 has high validation SRCC but also high training loss initially, indicating potential overfitting.
- A4 has low training loss but poor validation performance, suggesting underfitting or misalignment with the validation metric.
---
### Interpretation
- **Model Effectiveness**:
- A1 and A2 balance high validation performance with moderate training loss, making them strong candidates.
- A3 variants show moderate performance, with A3c being the most stable.
- A4’s low training loss but poor validation SRCC highlights a mismatch between training and validation objectives.
- **Gate Threshold**:
- The Gate line (0.80) serves as a performance benchmark. Models above it (A1-A3) meet or exceed this standard, while A4 falls short.
- **Training Dynamics**:
- A1’s sharp initial loss reduction suggests aggressive optimization, but its plateau at ~0.4 loss may indicate saturation.
- A4’s consistently low loss implies efficient training but insufficient capacity to capture validation complexity.
---
### Spatial Grounding & Verification
- **Legend Placement**: Right side of both graphs, ensuring clear association with line colors.
- **Color Consistency**: Confirmed matches between legend labels and line colors (e.g., A1 = orange, A4 = red).
- **Axis Alignment**: Both graphs use linear scales for epochs (0–20) and their respective metrics.
---
### Content Details
- **Validation SRCC (MI)**:
- A1: Peaks at 0.85 (epoch 5), ends at 0.83.
- A2: Peaks at 0.83 (epoch 5), ends at 0.82.
- A3a: Peaks at 0.84 (epoch 5), ends at 0.83.
- A3b: Peaks at 0.83 (epoch 5), ends at 0.81.
- A3c: Stable at 0.82–0.84.
- A4: 0.75–0.78.
- **Training Loss**:
- A1: Drops from 6 to 0.4 (epoch 2–20).
- A2: Drops from 2.5 to 1.8.
- A3a: Drops from 2.2 to 1.9.
- A3b: Drops from 2.1 to 1.7.
- A3c: Drops from 2.0 to 1.6.
- A4: Drops from 0.8 to 0.3.
---
### Notable Anomalies
- **A1’s Training Loss**: Unusually high initial value (~6) compared to other models, suggesting a different optimization trajectory or data scaling issue.
- **A4’s Validation SRCC**: Persistently below the Gate threshold despite low training loss, indicating potential underfitting or metric misalignment.