\n
## Bar Chart: Overlap Ratio Distribution
### Overview
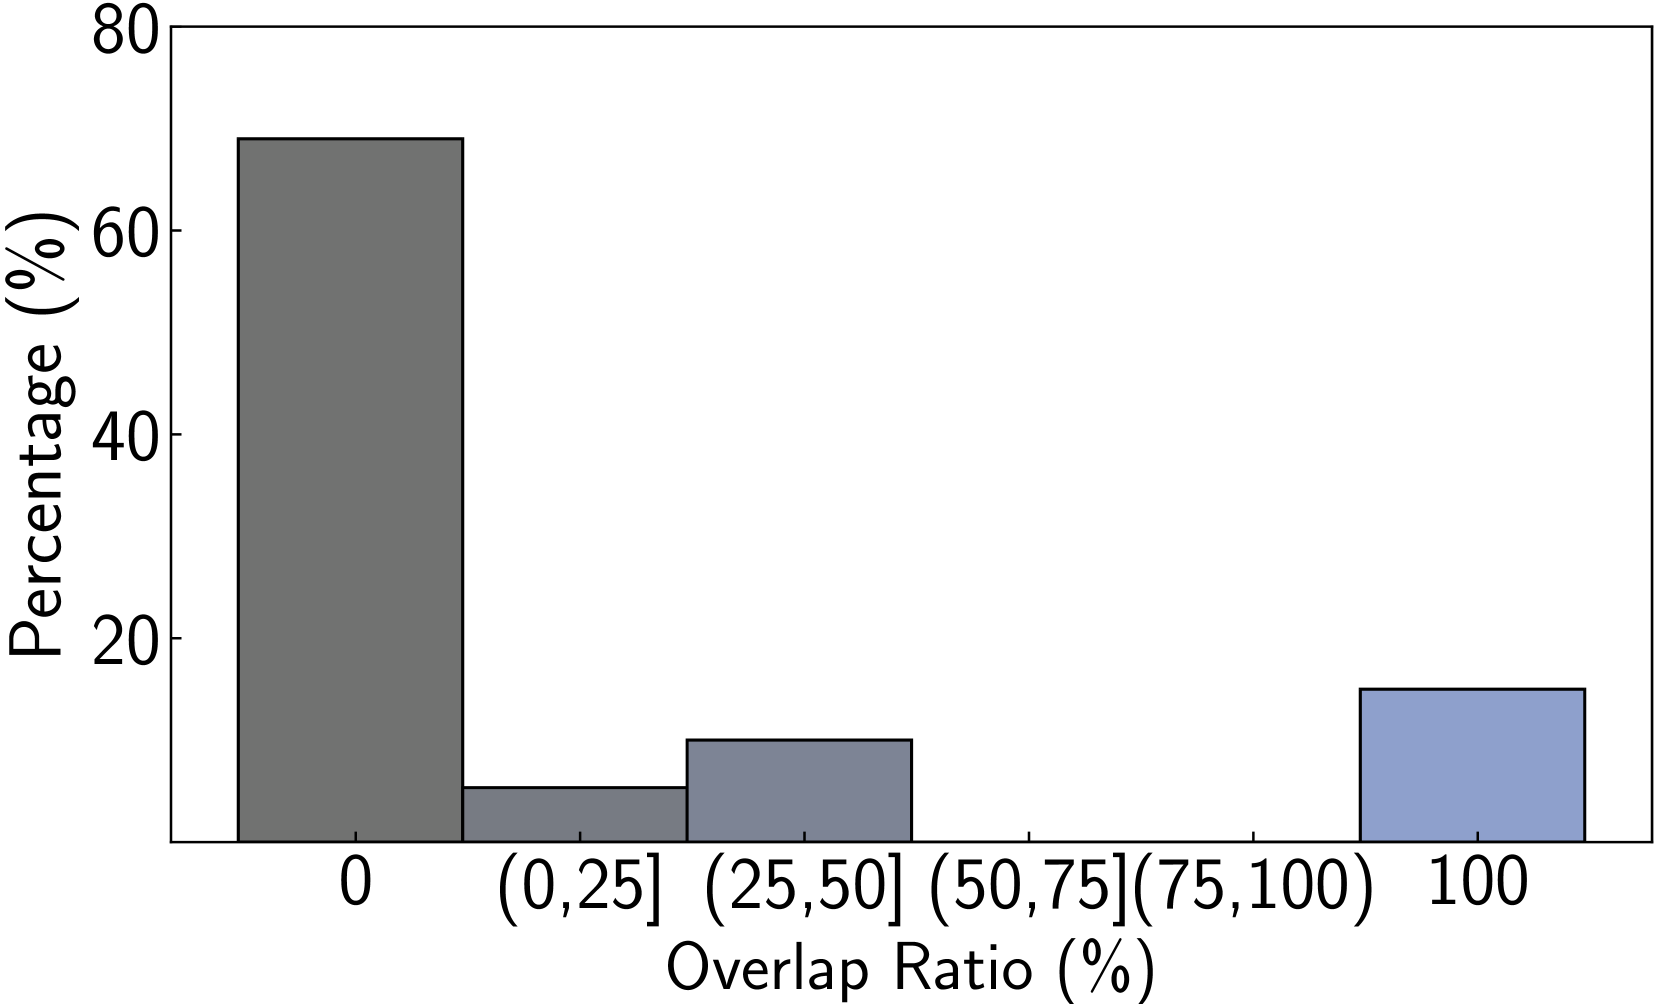
The image presents a bar chart illustrating the distribution of overlap ratios. The x-axis represents the overlap ratio in percentage, categorized into bins, and the y-axis represents the percentage of occurrences within each bin.
### Components/Axes
* **X-axis Title:** "Overlap Ratio (%)"
* **Y-axis Title:** "Percentage (%)"
* **X-axis Categories:** 0, (0,25], (25,50], (50,75], (75,100], 100
* **Y-axis Scale:** 0 to 80, with increments of 10.
* **Bars:** Represent the percentage of occurrences for each overlap ratio bin.
### Detailed Analysis
The chart displays the following approximate values:
* **Overlap Ratio 0:** The bar reaches approximately 72% on the y-axis.
* **Overlap Ratio (0,25]:** The bar reaches approximately 8% on the y-axis.
* **Overlap Ratio (25,50]:** The bar reaches approximately 10% on the y-axis.
* **Overlap Ratio (50,75]:** The bar reaches approximately 2% on the y-axis.
* **Overlap Ratio (75,100]:** The bar reaches approximately 0% on the y-axis.
* **Overlap Ratio 100:** The bar reaches approximately 17% on the y-axis.
The bars are positioned along the x-axis, corresponding to their respective overlap ratio categories. The height of each bar indicates the percentage of occurrences within that category.
### Key Observations
* The distribution is heavily skewed towards an overlap ratio of 0, with approximately 72% of the data falling into this category.
* There is a secondary peak at an overlap ratio of 100, representing approximately 17% of the data.
* Overlap ratios between 25% and 75% are relatively rare, with percentages below 10%.
* The overlap ratio between 75% and 100% has a percentage of approximately 0%.
### Interpretation
The data suggests that the majority of instances have no overlap (0% overlap ratio), while a significant portion exhibit complete overlap (100% overlap ratio). The scarcity of intermediate overlap ratios indicates a bimodal distribution. This could imply that the phenomenon being measured is either absent or fully present, with very few cases falling in between.
Possible explanations for this distribution include:
* **Binary Outcome:** The measured variable represents a binary outcome (e.g., present/absent, success/failure).
* **Threshold Effect:** There might be a threshold beyond which overlap is considered complete, leading to a concentration of values at 0% and 100%.
* **Data Collection Bias:** The data collection process might be biased towards capturing only instances with no or complete overlap.
Further investigation is needed to understand the underlying reasons for this distribution and its implications. The context of the overlap ratio is crucial for a more meaningful interpretation.