## Bar Chart: Overlap Ratio Distribution
### Overview
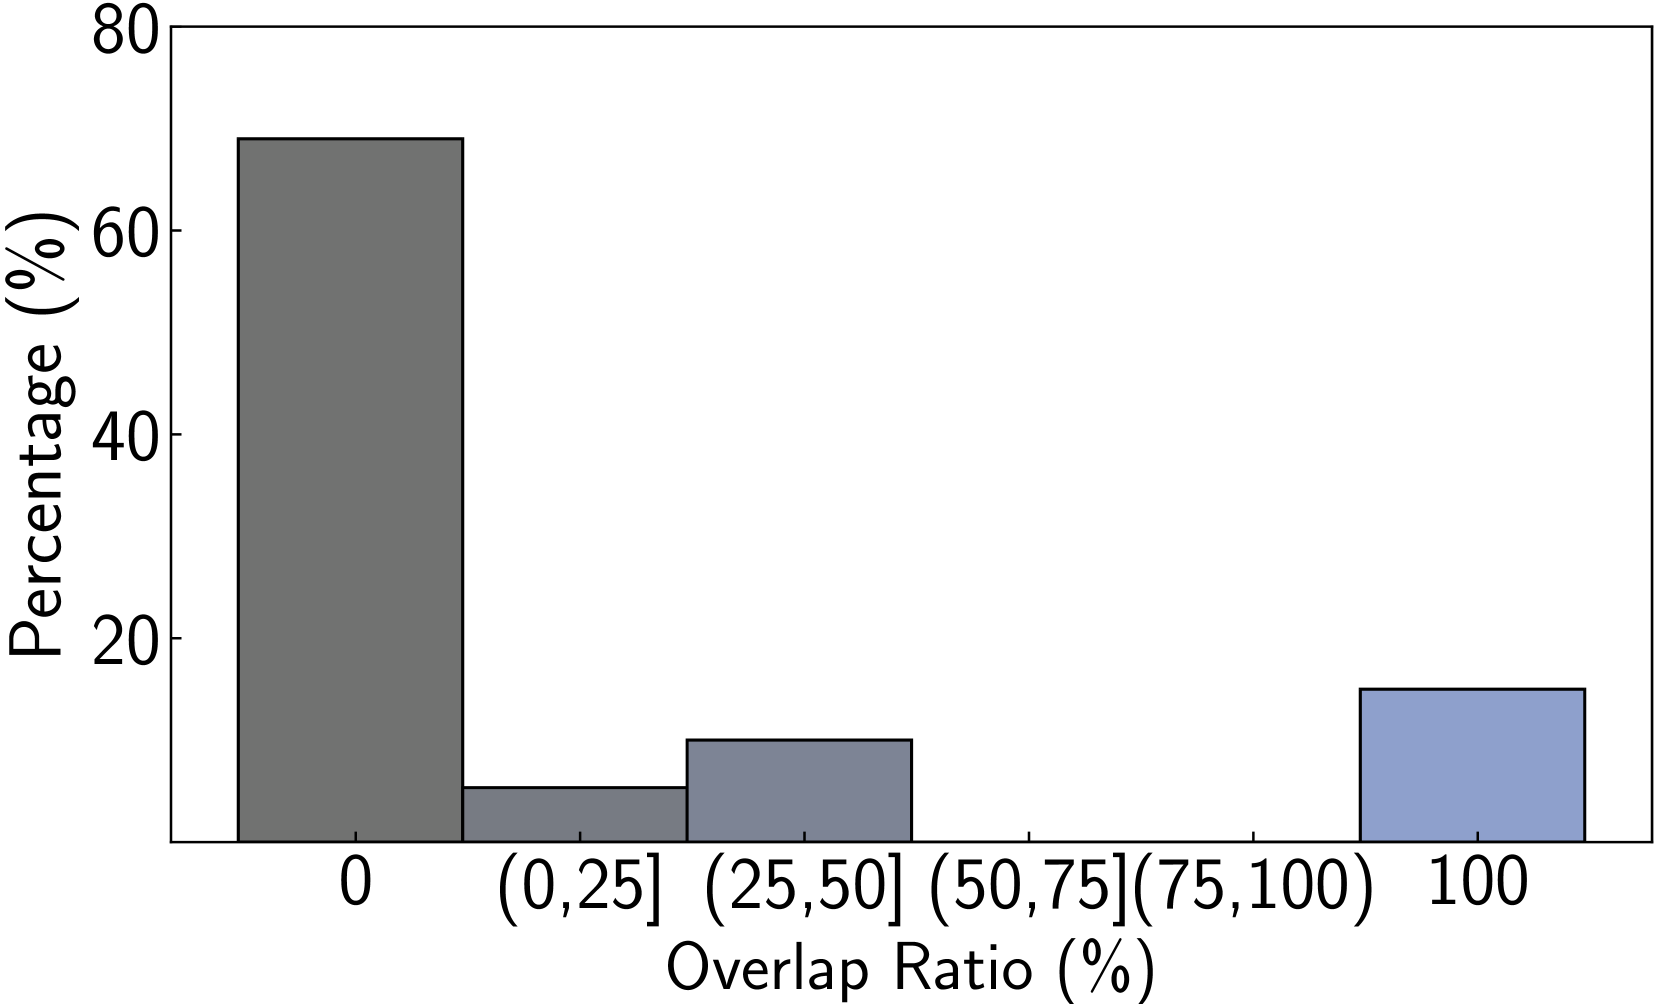
The chart displays a distribution of overlap ratios across six categories, with percentages represented by two bars. The x-axis categorizes overlap ratios, while the y-axis shows the percentage of occurrences. Two distinct bars are present: one at the "0" category and another at the "100" category, with no bars in the intermediate ranges.
### Components/Axes
- **X-axis (Overlap Ratio (%))**: Categories labeled as "0", "(0,25]", "(25,50]", "(50,75]", "(75,100]", and "100".
- **Y-axis (Percentage (%))**: Scaled from 0 to 80 in increments of 20.
- **Legend**: Not explicitly visible in the image.
- **Bars**:
- Dark gray bar at "0" (Overlap Ratio).
- Light blue bar at "100" (Overlap Ratio).
### Detailed Analysis
- **Dark Gray Bar (0 Overlap Ratio)**: Approximately 70% of the total occurrences.
- **Light Blue Bar (100 Overlap Ratio)**: Approximately 15% of the total occurrences.
- **Intermediate Categories**: No bars present for "(0,25]", "(25,50]", "(50,75]", or "(75,100]".
### Key Observations
1. The majority of occurrences (70%) are concentrated at the "0" overlap ratio.
2. A smaller portion (15%) occurs at the "100" overlap ratio.
3. No data points exist for overlap ratios between 0 and 100, suggesting a bimodal or extreme distribution.
### Interpretation
The data indicates a strong skew toward minimal overlap (0%) and a smaller but notable presence of maximal overlap (100%). The absence of intermediate values suggests that overlaps are either negligible or complete, with no partial overlaps observed. This could reflect a binary or threshold-based system where overlaps are categorized as either absent or fully present. The lack of a legend limits direct interpretation of the bar colors, but their distinct hues (dark gray vs. light blue) may imply separate data series or categories. The chart highlights a polarized distribution, emphasizing extremes over middle-ground values.