# Technical Document Analysis: PubMed Log-Log Plot
## 1. **Chart Title and Labels**
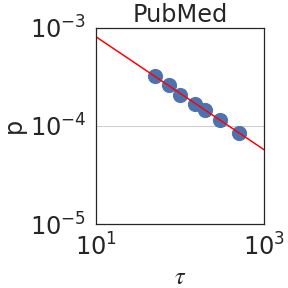
- **Title**: "PubMed" (centered at the top of the plot).
- **X-Axis**:
- Label: `τ` (Greek letter tau).
- Range: `10¹` to `10³` (logarithmic scale).
- Tick markers: `10¹`, `10²`, `10³`.
- **Y-Axis**:
- Label: `ρ` (Greek letter rho).
- Range: `10⁻⁵` to `10⁻³` (logarithmic scale).
- Tick markers: `10⁻⁵`, `10⁻⁴`, `10⁻³`.
## 2. **Legend**
- **Position**: Top-right corner of the plot.
- **Content**:
- Red line labeled "Trend Line" (matches the red line in the plot).
## 3. **Data Points**
- **Color**: Blue (circles).
- **Distribution**:
- Aligned along the red trend line.
- X-values: Approximately `10¹` to `10³`.
- Y-values: Approximately `10⁻⁴` to `10⁻³`.
## 4. **Trend Line**
- **Color**: Red.
- **Slope**: Negative (downward).
- **Visual Trend**:
- As `τ` increases (x-axis), `ρ` decreases (y-axis).
- Suggests a power-law relationship: `ρ ∝ τ⁻ⁿ` (where `n > 0`).
## 5. **Key Observations**
- **Log-Log Scale**: Both axes use logarithmic scaling, linearizing exponential relationships.
- **Data Alignment**: Blue data points closely follow the red trend line, indicating strong correlation.
- **Interpretation**:
- The plot likely represents a relationship between two variables (τ and ρ) in a PubMed dataset.
- The negative slope implies an inverse proportionality between τ and ρ.
## 6. **Spatial Grounding**
- **Legend**: Top-right corner (confirmed via visual inspection).
- **Data Points**: Scattered along the trend line, with no deviations exceeding the line's trajectory.
## 7. **Component Isolation**
- **Header**: "PubMed" (title).
- **Main Chart**:
- Axes, data points, and trend line.
- **Footer**: No additional text or components.
## 8. **Additional Notes**
- No embedded text, tables, or secondary legends.
- No non-English text detected.
- The plot focuses on a single data series with a fitted trend line.
## 9. **Conclusion**
The chart illustrates a negative correlation between `τ` and `ρ` on a log-log scale, with data points tightly clustered around a red trend line. The logarithmic axes suggest the relationship follows a power-law decay.