# Technical Document Extraction: PubMed Data Plot
## 1. Component Isolation
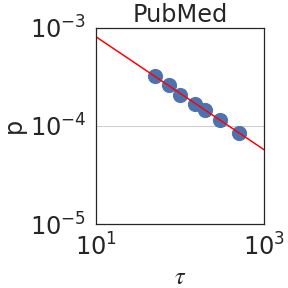
* **Header:** Contains the title "PubMed".
* **Main Chart Area:** A log-log scatter plot with a linear regression line.
* **Axes:**
* **Y-axis (Vertical):** Labeled "$p$".
* **X-axis (Horizontal):** Labeled "$\tau$".
## 2. Metadata and Labels
* **Title:** PubMed
* **Y-axis Label:** $p$ (likely representing probability or a density function).
* **X-axis Label:** $\tau$ (tau, likely representing a time interval or scale).
* **Y-axis Scale:** Logarithmic, ranging from $10^{-5}$ to $10^{-3}$. Major tick marks are visible at $10^{-5}$, $10^{-4}$, and $10^{-3}$.
* **X-axis Scale:** Logarithmic, ranging from $10^1$ to $10^3$. Major tick marks are visible at $10^1$ and $10^3$.
## 3. Data Series Analysis
The chart contains two primary visual elements representing data:
### Series 1: Observed Data Points
* **Visual Description:** Seven blue circular markers.
* **Trend Verification:** The points follow a consistent downward slope from left to right.
* **Spatial Distribution:** The points are clustered between $x \approx 5 \times 10^1$ and $x \approx 7 \times 10^2$.
| Point | Estimated $\tau$ (X-axis) | Estimated $p$ (Y-axis) |
| :--- | :--- | :--- |
| 1 | $\approx 60$ | $\approx 3 \times 10^{-4}$ |
| 2 | $\approx 80$ | $\approx 2.5 \times 10^{-4}$ |
| 3 | $\approx 100$ | $\approx 2 \times 10^{-4}$ |
| 4 | $\approx 150$ | $\approx 1.6 \times 10^{-4}$ |
| 5 | $\approx 200$ | $\approx 1.4 \times 10^{-4}$ |
| 6 | $\approx 400$ | $\approx 1 \times 10^{-4}$ |
| 7 | $\approx 700$ | $\approx 8 \times 10^{-5}$ |
### Series 2: Regression/Fit Line
* **Visual Description:** A solid red line.
* **Trend Verification:** The line slopes downward, indicating a power-law relationship ($p \propto \tau^{-\alpha}$).
* **Placement:** The line passes directly through the center of the blue data points, acting as a "best fit" model. It extends from the left boundary ($10^1$) to the right boundary ($10^3$).
* **Intercepts:**
* At $\tau = 10^1$, $p \approx 8 \times 10^{-4}$.
* At $\tau = 10^3$, $p \approx 5 \times 10^{-5}$.
## 4. Key Trends and Observations
* **Power-Law Relationship:** Because the data forms a straight line on a log-log plot, it indicates a power-law distribution between the variables $\tau$ and $p$.
* **Negative Correlation:** As the value of $\tau$ increases, the value of $p$ decreases at a constant scaling rate.
* **Reference Line:** There is a faint horizontal grey grid line at $p = 10^{-4}$ which serves as a visual anchor for the data points. The data points cross this threshold at approximately $\tau = 400$.
## 5. Language Declaration
* **Primary Language:** English.
* **Symbols:** Greek letter $\tau$ (Tau) is used as a mathematical variable.