TECHNICAL ASSET FINGERPRINT
1dc17b0fdc3be8f46bb3e60f
Click to view fullscreen
Press ESC or click to close
FOUND IN PAPERS
EXPERT: gemma-3-27b-it-free VERSION 1
RUNTIME: google-free/gemma-3-27b-it
INTEL_VERIFIED
## Line Chart: ΔP vs. Layer for Llama-3 Models
### Overview
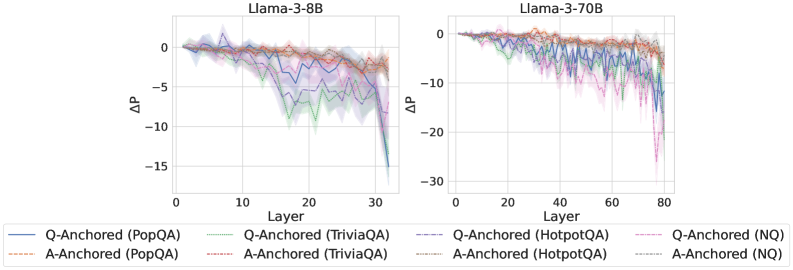
The image presents two line charts comparing the change in performance (ΔP) across layers for two Llama-3 models: Llama-3-8B and Llama-3-70B. The x-axis represents the layer number, and the y-axis represents ΔP. Each chart displays multiple lines, each representing a different question-answering dataset and anchoring method.
### Components/Axes
* **Title (Left Chart):** Llama-3-8B
* **Title (Right Chart):** Llama-3-70B
* **X-axis Label (Both Charts):** Layer
* **Y-axis Label (Both Charts):** ΔP
* **X-axis Scale (Left Chart):** 0 to 30
* **X-axis Scale (Right Chart):** 0 to 80
* **Y-axis Scale (Both Charts):** -30 to 0
* **Legend (Bottom-Center):**
* Q-Anchored (PopQA) - Blue Line
* A-Anchored (PopQA) - Orange Dotted Line
* Q-Anchored (TriviaQA) - Green Line
* A-Anchored (TriviaQA) - Purple Dotted Line
* Q-Anchored (HotpotQA) - Brown Dotted Line
* A-Anchored (HotpotQA) - Pink Dotted Line
* Q-Anchored (NQ) - Teal Line
* A-Anchored (NQ) - Red Dotted Line
### Detailed Analysis or Content Details
**Llama-3-8B Chart:**
* **Q-Anchored (PopQA):** The blue line starts at approximately ΔP = 0 at Layer 0, remains relatively stable around ΔP = -1 to -2 from Layer 0 to Layer 15, then declines steadily to approximately ΔP = -11 at Layer 30.
* **A-Anchored (PopQA):** The orange dotted line starts at approximately ΔP = 0 at Layer 0, remains relatively stable around ΔP = -1 to -2 from Layer 0 to Layer 15, then declines steadily to approximately ΔP = -8 at Layer 30.
* **Q-Anchored (TriviaQA):** The green line starts at approximately ΔP = 0 at Layer 0, remains relatively stable around ΔP = -1 to -2 from Layer 0 to Layer 15, then declines steadily to approximately ΔP = -9 at Layer 30.
* **A-Anchored (TriviaQA):** The purple dotted line starts at approximately ΔP = 0 at Layer 0, remains relatively stable around ΔP = -1 to -2 from Layer 0 to Layer 15, then declines steadily to approximately ΔP = -7 at Layer 30.
* **Q-Anchored (HotpotQA):** The brown dotted line starts at approximately ΔP = 0 at Layer 0, remains relatively stable around ΔP = -1 to -2 from Layer 0 to Layer 15, then declines steadily to approximately ΔP = -8 at Layer 30.
* **A-Anchored (HotpotQA):** The pink dotted line starts at approximately ΔP = 0 at Layer 0, remains relatively stable around ΔP = -1 to -2 from Layer 0 to Layer 15, then declines steadily to approximately ΔP = -7 at Layer 30.
* **Q-Anchored (NQ):** The teal line starts at approximately ΔP = 0 at Layer 0, remains relatively stable around ΔP = -1 to -2 from Layer 0 to Layer 15, then declines steadily to approximately ΔP = -10 at Layer 30.
* **A-Anchored (NQ):** The red dotted line starts at approximately ΔP = 0 at Layer 0, remains relatively stable around ΔP = -1 to -2 from Layer 0 to Layer 15, then declines steadily to approximately ΔP = -9 at Layer 30.
**Llama-3-70B Chart:**
* **Q-Anchored (PopQA):** The blue line starts at approximately ΔP = 0 at Layer 0, remains relatively stable around ΔP = -1 to -2 from Layer 0 to Layer 50, then declines more rapidly to approximately ΔP = -12 at Layer 80.
* **A-Anchored (PopQA):** The orange dotted line starts at approximately ΔP = 0 at Layer 0, remains relatively stable around ΔP = -1 to -2 from Layer 0 to Layer 50, then declines more rapidly to approximately ΔP = -10 at Layer 80.
* **Q-Anchored (TriviaQA):** The green line starts at approximately ΔP = 0 at Layer 0, remains relatively stable around ΔP = -1 to -2 from Layer 0 to Layer 50, then declines more rapidly to approximately ΔP = -13 at Layer 80.
* **A-Anchored (TriviaQA):** The purple dotted line starts at approximately ΔP = 0 at Layer 0, remains relatively stable around ΔP = -1 to -2 from Layer 0 to Layer 50, then declines more rapidly to approximately ΔP = -11 at Layer 80.
* **Q-Anchored (HotpotQA):** The brown dotted line starts at approximately ΔP = 0 at Layer 0, remains relatively stable around ΔP = -1 to -2 from Layer 0 to Layer 50, then declines more rapidly to approximately ΔP = -12 at Layer 80.
* **A-Anchored (HotpotQA):** The pink dotted line starts at approximately ΔP = 0 at Layer 0, remains relatively stable around ΔP = -1 to -2 from Layer 0 to Layer 50, then declines more rapidly to approximately ΔP = -10 at Layer 80.
* **Q-Anchored (NQ):** The teal line starts at approximately ΔP = 0 at Layer 0, remains relatively stable around ΔP = -1 to -2 from Layer 0 to Layer 50, then declines more rapidly to approximately ΔP = -15 at Layer 80.
* **A-Anchored (NQ):** The red dotted line starts at approximately ΔP = 0 at Layer 0, remains relatively stable around ΔP = -1 to -2 from Layer 0 to Layer 50, then declines more rapidly to approximately ΔP = -13 at Layer 80.
### Key Observations
* In both charts, all lines generally exhibit a downward trend, indicating a decrease in ΔP as the layer number increases.
* The Llama-3-70B model shows a more pronounced decline in ΔP compared to the Llama-3-8B model, especially in the later layers.
* The Q-Anchored lines generally have lower ΔP values than the A-Anchored lines for the same dataset.
* The NQ dataset consistently shows the lowest ΔP values across both models.
### Interpretation
The charts demonstrate how performance changes across layers in the Llama-3 models when evaluated on different question-answering datasets using question-anchored (Q-Anchored) and answer-anchored (A-Anchored) methods. The negative ΔP values suggest a degradation in performance as the model progresses through its layers.
The steeper decline in ΔP for the Llama-3-70B model indicates that the larger model may be more susceptible to performance degradation in deeper layers. The difference between Q-Anchored and A-Anchored lines suggests that the method of anchoring the questions or answers impacts performance, with question-anchoring generally leading to lower ΔP values. The consistently lower performance on the NQ dataset suggests that this dataset presents a greater challenge for the models.
The overall trend suggests that while the models perform well in the initial layers, their performance deteriorates as they process information through deeper layers. This could be due to issues like vanishing gradients or the accumulation of errors during processing. Further investigation is needed to understand the underlying causes of this performance degradation and to develop strategies for mitigating it.
DECODING INTELLIGENCE...