## Line Graphs: Llama-3-8B and Llama-3-70B Performance Trends
### Overview
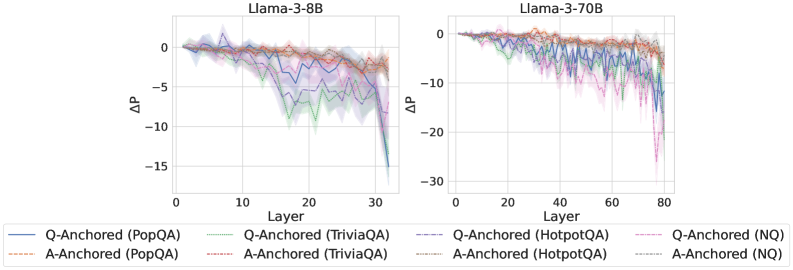
The image contains two line graphs comparing performance degradation (ΔP) across transformer layers for two Llama-3 model variants (8B and 70B parameters). Each graph tracks multiple data series representing different question-answering datasets (PopQA, TriviaQA, HotpotQA, NQ) and anchoring strategies (Q-Anchored vs. A-Anchored). The graphs show layer-wise performance shifts, with ΔP values plotted against layer indices.
### Components/Axes
- **X-axis (Layer)**:
- Left graph: 0–30 (Llama-3-8B)
- Right graph: 0–80 (Llama-3-70B)
- **Y-axis (ΔP)**:
- Left graph: -15 to 0
- Right graph: -30 to 0
- **Legend**:
- Colors/styles map to:
- Q-Anchored (PopQA): Solid blue
- Q-Anchored (TriviaQA): Dashed green
- Q-Anchored (HotpotQA): Dotted purple
- Q-Anchored (NQ): Dash-dot pink
- A-Anchored (PopQA): Solid red
- A-Anchored (TriviaQA): Dashed orange
- A-Anchored (HotpotQA): Dotted brown
- A-Anchored (NQ): Dash-dot gray
- **Placement**: Legends at bottom; left graph on left, right graph on right.
### Detailed Analysis
#### Llama-3-8B (Left Graph)
- **Trends**:
- All lines start near ΔP=0 at layer 0.
- Gradual decline to ΔP≈-10 by layer 30, with oscillations.
- Q-Anchored (HotpotQA) shows steepest drop (-12 to -15 range).
- A-Anchored (NQ) remains closest to 0 (-2 to -4 range).
- **Key Data Points**:
- Q-Anchored (PopQA): 0 → -8 (layer 30)
- A-Anchored (HotpotQA): 0 → -5 (layer 30)
#### Llama-3-70B (Right Graph)
- **Trends**:
- Steeper overall decline than 8B variant.
- ΔP reaches -25 to -30 in later layers (60–80).
- Q-Anchored (HotpotQA) drops most sharply (-30 at layer 80).
- A-Anchored (NQ) stabilizes at ΔP≈-10.
- **Key Data Points**:
- Q-Anchored (PopQA): 0 → -20 (layer 80)
- A-Anchored (HotpotQA): 0 → -25 (layer 80)
### Key Observations
1. **Model Size Impact**: Larger model (70B) exhibits 2–3× greater ΔP magnitude than 8B across all datasets.
2. **Anchoring Strategy**: Q-Anchored consistently underperforms A-Anchored, with HotpotQA showing the largest gap (ΔP difference: -10 to -15 in 70B).
3. **Dataset Sensitivity**: HotpotQA induces the steepest performance degradation, followed by TriviaQA and NQ.
4. **Layer Dynamics**: Performance degradation accelerates in deeper layers (layers 40–80 in 70B).
### Interpretation
The data demonstrates that:
- **Model Scale Amplifies Degradation**: Larger models (70B) suffer more severe performance drops, particularly in complex reasoning tasks (HotpotQA).
- **Anchoring Matters**: A-Anchored models mitigate degradation better, suggesting architectural choices influence robustness.
- **Task Complexity Correlation**: HotpotQA’s steep decline implies it relies more heavily on early-layer representations, which degrade faster in deeper models.
- **Stability in NQ**: Minimal ΔP for NQ suggests it depends less on layer-specific features, possibly relying on surface-level patterns.
This analysis highlights trade-offs between model scale, architectural design, and task-specific performance in transformer-based QA systems.