## Line Graphs: Episodes Until Average Regret < 0.5 vs. Chain Length (Log Scale)
### Overview
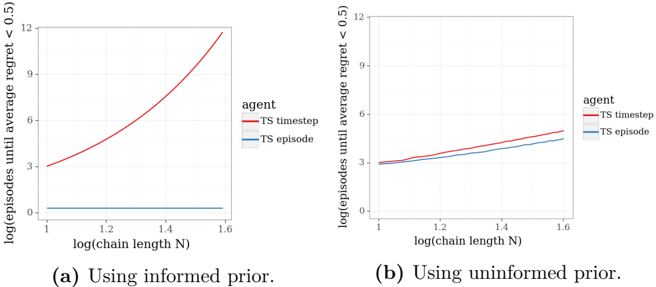
Two line graphs compare the logarithmic relationship between chain length (N) and the number of episodes required for average regret to drop below 0.5. Graph (a) uses an "informed prior," while graph (b) uses an "uninformed prior." Both graphs show distinct trends for two agents: "TS timestep" (red) and "TS episode" (blue).
---
### Components/Axes
- **X-axis**: `log(chain length N)` (logarithmic scale, values: 1.0 to 1.6)
- **Y-axis**: `log(episodes until average regret < 0.5)` (logarithmic scale, values: 0 to 12)
- **Legends**:
- **Graph (a)**:
- Red: "TS timestep"
- Blue: "TS episode"
- **Graph (b)**:
- Red: "TS timestep"
- Blue: "TS episode"
- **Legend Placement**: Right side of each graph.
---
### Detailed Analysis
#### Graph (a): Using Informed Prior
- **TS timestep (Red)**:
- Starts at ~3 episodes (log scale) when `log(N) = 1.0`.
- Increases sharply to ~12 episodes as `log(N)` approaches 1.6.
- **Trend**: Strong positive correlation between chain length and episodes.
- **TS episode (Blue)**:
- Remains flat at ~0.1 episodes across all `log(N)` values.
- **Trend**: No dependency on chain length.
#### Graph (b): Using Uninformed Prior
- **TS timestep (Red)**:
- Starts at ~3 episodes (log scale) when `log(N) = 1.0`.
- Gradually increases to ~5–6 episodes as `log(N)` approaches 1.6.
- **Trend**: Mild positive correlation.
- **TS episode (Blue)**:
- Starts slightly below TS timestep (~2.5 episodes) at `log(N) = 1.0`.
- Increases steadily to ~4–5 episodes as `log(N)` approaches 1.6.
- **Trend**: Stronger positive correlation than TS timestep.
---
### Key Observations
1. **Graph (a)**:
- TS timestep performance degrades significantly with longer chains (log scale).
- TS episode remains unaffected by chain length.
2. **Graph (b)**:
- Both agents show improved performance with longer chains.
- TS episode consistently outperforms TS timestep across all chain lengths.
3. **Color Consistency**:
- Red lines (TS timestep) match legends in both graphs.
- Blue lines (TS episode) match legends in both graphs.
---
### Interpretation
- **Informed Prior (a)**:
- TS timestep’s sharp decline suggests overfitting or sensitivity to prior assumptions in longer chains.
- TS episode’s flat line implies robustness to chain length under informed priors.
- **Uninformed Prior (b)**:
- Both agents benefit from longer chains, indicating better generalization without prior constraints.
- TS episode’s steeper improvement suggests it leverages chain length more effectively than TS timestep.
- **Practical Implication**:
- Informed priors may hinder TS timestep’s scalability, while uninformed priors enable both methods to adapt to longer chains.
- TS episode appears more efficient in regret minimization across scenarios.