\n
## Chart: Financial Time Series (Candlestick Chart)
### Overview
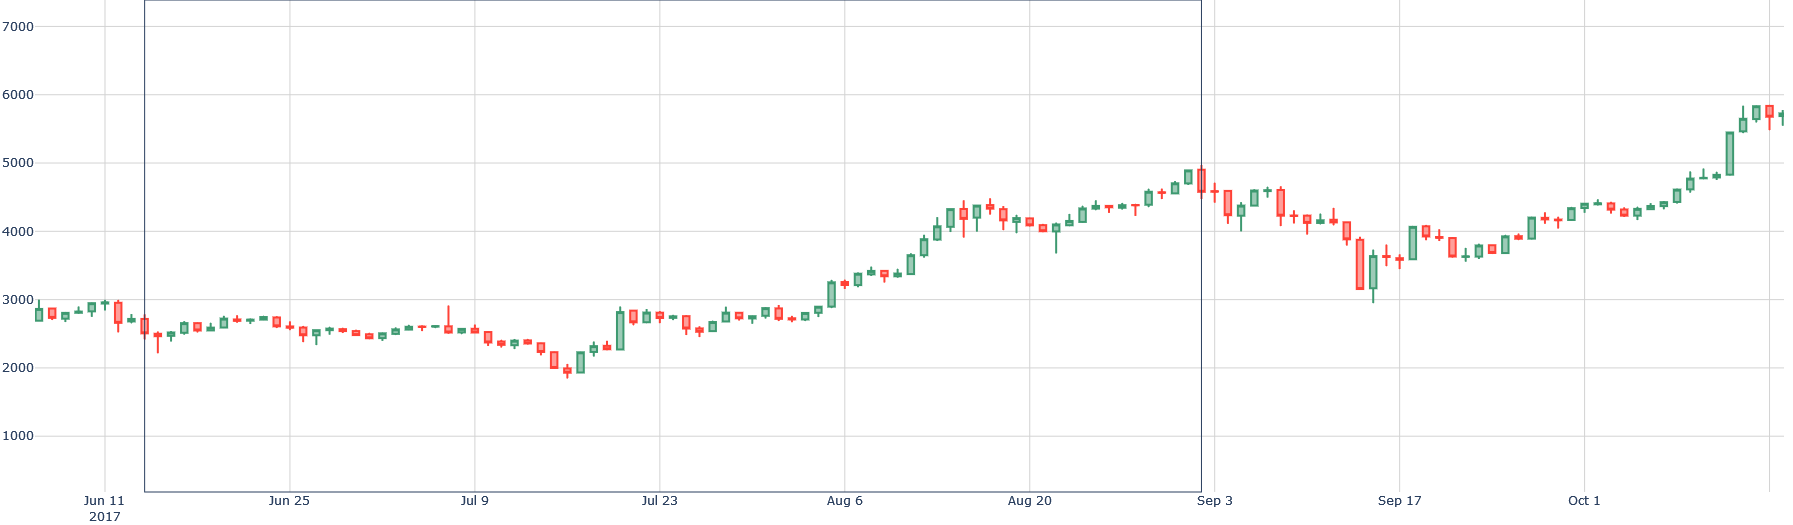
The image presents a candlestick chart depicting a financial time series, likely stock prices or a similar asset, over a period from June 11, 2017, to approximately October 1, 2017. The chart displays daily fluctuations with "candles" representing the open, high, low, and close prices for each day. Green candles indicate a closing price higher than the opening price, while red candles indicate the opposite.
### Components/Axes
* **X-axis:** Represents time, with dates marked approximately every two weeks from June 11, 2017, to October 1, 2017. Specific dates marked are: Jun 11, Jun 25, Jul 9, Jul 23, Aug 6, Aug 20, Sep 3, Sep 17, and Oct 1.
* **Y-axis:** Represents price, ranging from approximately 1000 to 7000. The scale is linear and evenly spaced.
* **Candlesticks:** Each candlestick represents a single day's trading activity.
* **Body:** The rectangular portion of the candle shows the range between the opening and closing prices.
* **Wicks (Shadows):** The thin lines extending above and below the body represent the highest and lowest prices reached during the day.
* **Color Coding:**
* Green: Closing price > Opening price (Bullish)
* Red: Closing price < Opening price (Bearish)
### Detailed Analysis
The chart shows a generally upward trend over the period, with significant volatility.
* **June 11 - July 9:** The price fluctuates between approximately 2000 and 3000, with a slight downward trend initially, followed by consolidation. There are alternating green and red candles, indicating frequent price swings.
* **July 9 - Aug 6:** A clear upward trend begins, with the price steadily increasing from around 2000 to approximately 4000. Predominantly green candles are observed during this period.
* **Aug 6 - Sep 3:** The price continues to rise, reaching a peak of around 4900. The trend is less consistent than the previous period, with more red candles interspersed.
* **Sep 3 - Sep 17:** A significant price drop occurs, with the price falling from approximately 4900 to around 3600. This is characterized by a series of large red candles.
* **Sep 17 - Oct 1:** The price recovers somewhat, rising from around 3600 to approximately 5300. The final days show a strong upward trend with large green candles.
**Approximate Data Points (based on visual estimation):**
| Date | Open | Close |
|----------|-------|-------|
| Jun 11 | ~2800 | ~2800 |
| Jun 25 | ~2600 | ~2800 |
| Jul 9 | ~2200 | ~2400 |
| Jul 23 | ~2800 | ~3000 |
| Aug 6 | ~3500 | ~3800 |
| Aug 20 | ~4200 | ~4300 |
| Sep 3 | ~4600 | ~4800 |
| Sep 17 | ~3800 | ~3600 |
| Oct 1 | ~4800 | ~5300 |
It's important to note that these are approximate values read from the chart and may not be precise.
### Key Observations
* **Volatility:** The chart exhibits significant price volatility throughout the period.
* **Major Downturn:** The period between September 3rd and September 17th shows a substantial price decline.
* **Strong Recovery:** The price experiences a strong recovery in the final week of the observed period.
* **Overall Upward Trend:** Despite the volatility and downturn, the overall trend is upward from June to October.
### Interpretation
The chart suggests a period of growth and volatility in the asset's price. The initial upward trend from July to August indicates positive market sentiment. The sharp decline in September could be attributed to a negative event or market correction. The subsequent recovery in late September and early October suggests renewed investor confidence or a rebound effect. The large green candles at the end of the period indicate strong buying pressure.
The candlestick pattern provides insights into the daily price action, revealing the range of price fluctuations and the balance between buyers and sellers. The alternating green and red candles demonstrate the dynamic nature of the market. The overall upward trend suggests a generally bullish outlook for the asset, but the volatility highlights the inherent risks involved in trading. The chart could be used to identify potential entry and exit points for traders, but further analysis and consideration of external factors would be necessary for informed decision-making.