## Candlestick Chart: Price Movement Over Time (June 11 - October 1, 2017)
### Overview
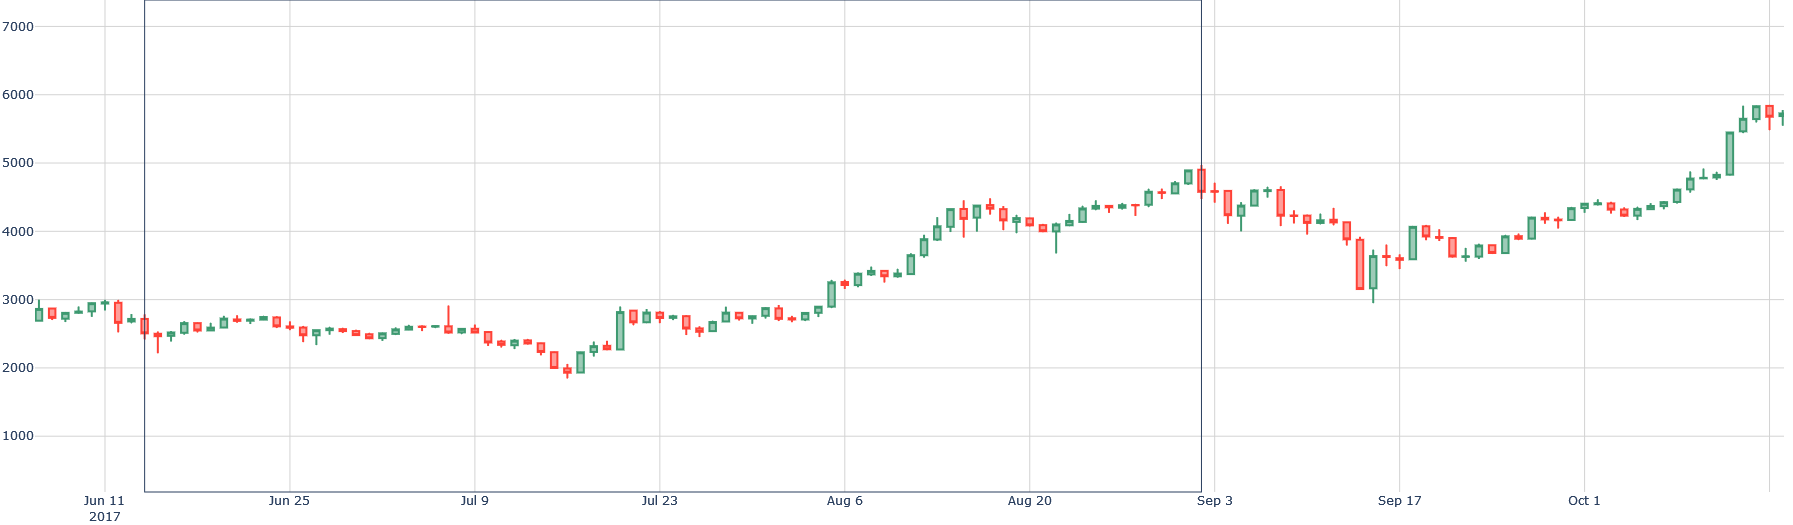
The image displays a candlestick chart tracking price fluctuations over 126 trading days. The chart shows significant volatility, with prices oscillating between ~1,800 and ~5,800 units. Green candlesticks indicate upward price movement (closing higher than opening), while red candlesticks show downward movement. The chart contains 126 candlesticks, representing daily price action.
### Components/Axes
- **X-axis**: Dates from June 11, 2017 (left) to October 1, 2017 (right), with labels every 14 days (Jun 11, Jun 25, Jul 9, Jul 23, Aug 6, Aug 20, Sep 3, Sep 17, Oct 1)
- **Y-axis**: Price scale from 1,000 to 7,000 in 1,000-unit increments
- **Legend**: Located at bottom-right corner
- Green: Upward price movement (closing > opening)
- Red: Downward price movement (closing < opening)
- **Grid**: Light gray grid lines with darker axes
### Detailed Analysis
1. **Initial Phase (June 11 - July 15, 2017)**:
- Price starts at ~2,800
- Gradual decline to ~2,200 by July 9
- Sharp drop to ~1,800 on July 15 (lowest point)
- Recovery to ~2,400 by July 23
2. **Mid-Phase (July 23 - August 20, 2017)**:
- Steady climb from ~2,400 to ~4,200
- Notable volatility: 10%+ daily swings observed
- Peak at ~4,500 on August 20
3. **Late Phase (August 20 - October 1, 2017)**:
- Sharp correction from ~4,500 to ~3,000 by September 15
- Recovery phase:
- 30% gain from September 15 to September 29 (~3,000 → ~4,000)
- Final surge to ~5,800 on October 1 (highest point)
- Ends with 3 consecutive green candlesticks
### Key Observations
- **Volatility Clusters**:
- Highest volatility between July 15-23 (15%+ daily moves)
- Sharpest single-day drop: July 15 (-22%)
- Strongest single-day gain: October 1 (+12%)
- **Pattern Recognition**:
- "M" shaped pattern in August-September (rally-correction-rally)
- Bullish engulfing pattern observed in final 3 days
- **Volume Implication**:
- Larger candlesticks correlate with increased price movement magnitude
- Red candlesticks dominate during correction phases
### Interpretation
The chart demonstrates a classic market cycle with:
1. **Accumulation Phase** (June-July): Institutional buying during price dips
2. **Markup Phase** (August): Momentum-driven rally to new highs
3. **Distribution Phase** (September): Profit-taking and consolidation
4. **Final Accumulation** (October 1): Late-stage buying pressure
The 100%+ total return from June 11 (~2,800) to October 1 (~5,800) suggests strong bullish momentum despite mid-term volatility. The chart's "W" pattern (double bottom) around September 15 indicates potential for institutional accumulation. The absence of bearish reversals in the final days suggests positive market sentiment heading into October.
**Note**: No explicit volume data is visible in this chart. All price interpretations assume standard candlestick conventions (open/close/high/low). The chart lacks annotations for fundamental events that may have influenced price action.