## Diagram: Optical Communication System Architecture
### Overview
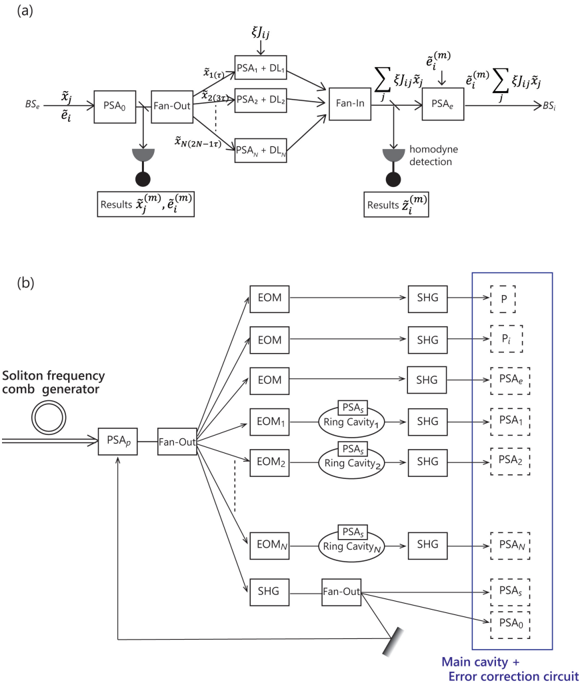
The image depicts two technical diagrams (labeled a and b) illustrating components and signal flow in an optical communication system. Diagram (a) shows a signal processing pathway with feedback loops, while diagram (b) illustrates a soliton frequency comb generator integrated with error correction and ring cavity systems.
### Components/Axes
#### Diagram (a): Signal Processing Pathway
- **Input**: BS_e (Beam Splitter) splits signal into two paths.
- **Path 1**:
- PSA0 (Phase-Sensitive Amplifier) → Fan-Out → Multiple PSA + DL (Phase-Sensitive Amplifier + Delay Line) stages (PSA₁+DL₁ to PSA_N+DL_N).
- Output: Results (x̃_j^(m), ẽ_i^(m)).
- **Path 2**:
- Summation of ξJ_ijx̃_j → Fan-In → PSA_e (Phase-Sensitive Amplifier) → Summation of ξJ_ijx̃_j → BS_i (Beam Splitter).
- **Key Elements**:
- Homodyne detection (black circle).
- Feedback loops (dashed lines).
#### Diagram (b): Soliton Frequency Comb + Error Correction
- **Input**: Soliton frequency comb generator → PSA_p (Phase-Sensitive Amplifier) → Fan-Out.
- **Fan-Out Branches**:
- Multiple EOMs (Electro-Optic Modulators) → SHGs (Second Harmonic Generators) → Ring Cavities (PSA₅, PSA₁, PSA₂, etc.).
- Feedback loops (dashed lines) between EOMs, SHGs, and Ring Cavities.
- **Output**:
- Main cavity + Error correction circuit (PSA₀ to PSA_N).
- **Key Elements**:
- Ring Cavities (labeled PSA₅, PSA₁, PSA₂, etc.).
- Error correction circuit (dashed box).
### Detailed Analysis
#### Diagram (a)
- **Signal Flow**:
1. BS_e splits input into two paths.
2. Path 1 amplifies and delays signals through PSA0 and multiple PSA+DL stages.
3. Path 2 combines signals via summation (ξJ_ijx̃_j) and processes through PSA_e.
4. Results (x̃_j^(m), ẽ_i^(m)) and homodyne detection outputs (z̃_i^(m)) are extracted.
- **Feedback**: Dashed lines indicate iterative signal refinement.
#### Diagram (b)
- **Soliton Frequency Comb**: Generates broadband light for PSA_p.
- **EOMs and SHGs**: Modulate and convert light frequencies.
- **Ring Cavities**: Provide feedback for stabilization (e.g., PSA₅, PSA₁, PSA₂).
- **Error Correction**: Dashed box suggests active correction of signal distortions.
### Key Observations
1. **Diagram (a)**:
- Feedback loops suggest adaptive signal processing.
- Homodyne detection implies quantum or precision measurement applications.
2. **Diagram (b)**:
- Ring cavities and error correction indicate a focus on stabilizing soliton combs for high-precision systems.
- Multiple EOMs/SHGs suggest complex frequency manipulation.
### Interpretation
- **Purpose**:
- Diagram (a) likely represents a quantum communication or metrology system, where homodyne detection and phase-sensitive amplification are critical.
- Diagram (b) appears to be a soliton-based optical clock or frequency synthesizer, with error correction to maintain comb stability.
- **Technical Insights**:
- The use of PSA+DL stages in (a) implies compensation for signal loss and phase noise.
- Ring cavities in (b) enable self-referencing of soliton combs, crucial for ultra-low phase noise applications.
- **Anomalies**:
- No explicit numerical values or error rates are provided, limiting quantitative analysis.
- Feedback loops in both diagrams suggest iterative optimization but lack details on control mechanisms.
## Conclusion
The diagrams illustrate advanced optical systems combining phase-sensitive amplification, frequency combs, and error correction. Diagram (a) focuses on signal processing with homodyne detection, while diagram (b) emphasizes soliton comb stabilization. Both highlight the integration of feedback and adaptive components for high-precision applications.