## Scatter Plots: Music Genre Distribution in Valid and Test Sets
### Overview
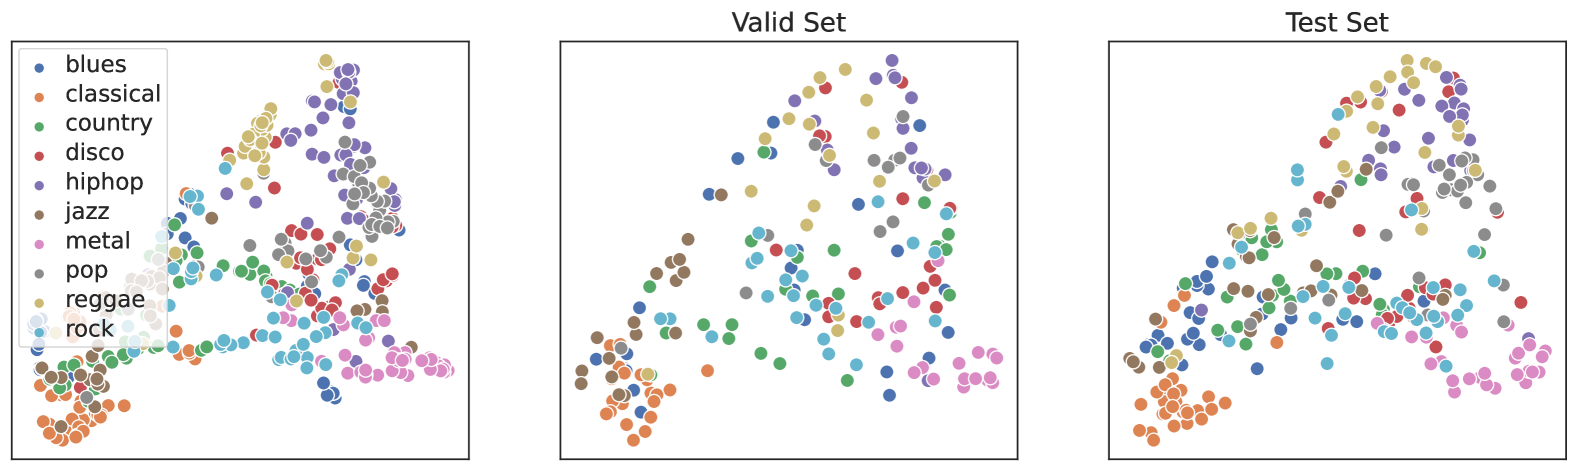
The image contains three scatter plots arranged horizontally. The leftmost plot includes a legend mapping 10 music genres to distinct colors (e.g., blues = blue, classical = orange, country = green). The middle and right plots are labeled "Valid Set" and "Test Set," respectively. All plots share identical axes (unlabeled x/y) and display overlapping clusters of colored points representing genre distributions.
### Components/Axes
- **Legend**: Located in the top-left corner of the leftmost plot.
- **Genres & Colors**:
- Blues (blue), Classical (orange), Country (green), Disco (red), Hip-hop (purple), Jazz (brown), Metal (pink), Pop (gray), Reggae (yellow), Rock (light blue).
- **Plots**:
- **Valid Set** (middle): Scatter plot with overlapping genre clusters.
- **Test Set** (right): Similar structure to Valid Set but with slightly different point distributions.
- **Axes**: Unlabeled x and y axes in all plots.
### Detailed Analysis
- **Genre Distribution**:
- **Blues (blue)**: Concentrated in the lower-left region of all plots.
- **Classical (orange)**: Dominates the bottom-left quadrant, with dense clusters in Valid and Test Sets.
- **Country (green)**: Spreads diagonally from bottom-left to mid-right in Valid Set; more dispersed in Test Set.
- **Disco (red)**: Clusters near the center-right in Valid Set; overlaps with pop (gray) in Test Set.
- **Hip-hop (purple)**: Forms a dense cluster in the upper-right of Valid Set; less cohesive in Test Set.
- **Jazz (brown)**: Scattered throughout but denser in the lower-middle region.
- **Metal (pink)**: Concentrated in the upper-right of Test Set; sparse in Valid Set.
- **Pop (gray)**: Widely distributed, with peaks in mid-right regions.
- **Reggae (yellow)**: Small clusters near the top-center of Valid Set; absent in Test Set.
- **Rock (light blue)**: Dominates the upper-right of Test Set; overlaps with hip-hop in Valid Set.
### Key Observations
1. **Cluster Overlap**: Genres like pop (gray) and disco (red) show significant overlap in Test Set, suggesting potential misclassification or shared features.
2. **Missing Data**: Reggae (yellow) appears only in Valid Set, indicating possible exclusion from the Test Set.
3. **Spatial Trends**:
- Blues and classical consistently occupy the lower-left, while hip-hop and rock dominate upper-right regions.
- Jazz and metal show less defined clustering, with points scattered across plots.
### Interpretation
The scatter plots likely visualize a dimensionality reduction (e.g., PCA or t-SNE) of audio features, where each point represents a song/artist. The Valid and Test Sets exhibit similar genre distributions, implying the model generalizes well across subsets. However, the absence of reggae in the Test Set and overlapping clusters (e.g., pop/disco) suggest potential limitations in data balance or feature separation. The spatial trends align with genre characteristics (e.g., classical’s complexity vs. hip-hop’s rhythmic density), but further analysis of feature weights would clarify these relationships.