## Scatter Plot: Music Genre Distribution
### Overview
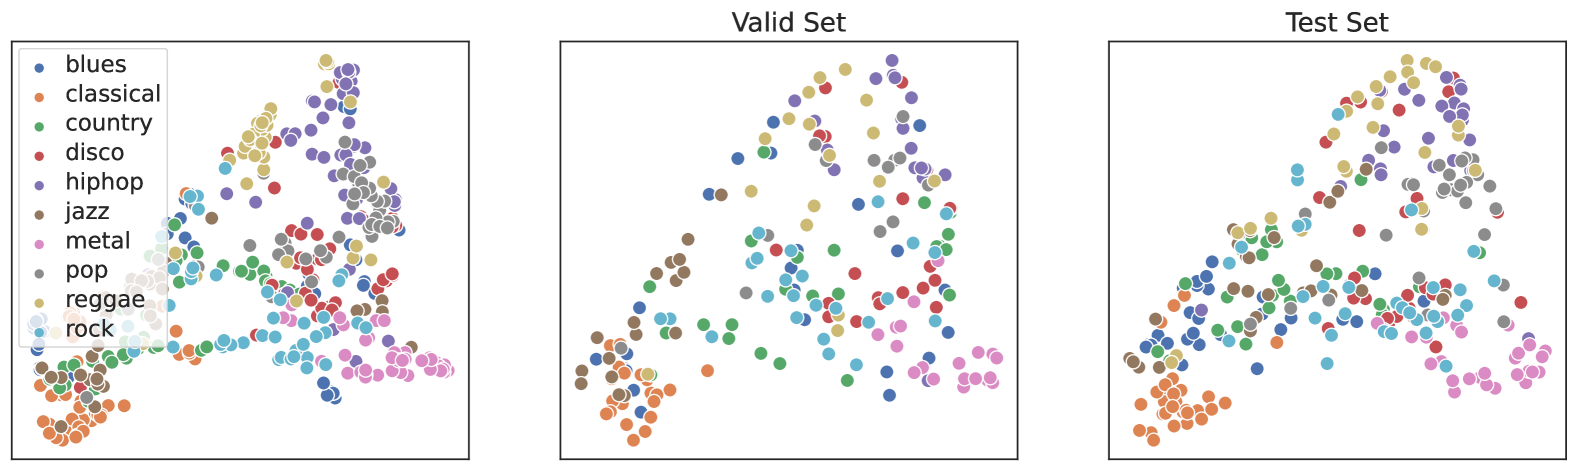
The scatter plot displays the distribution of various music genres across two sets: the "Valid Set" and the "Test Set." Each genre is represented by a different color, and the data points are plotted on a two-dimensional plane.
### Components/Axes
- **X-axis**: Represents the number of data points for each genre.
- **Y-axis**: Represents the number of data points for each genre.
- **Legend**: Located on the left side of the plot, it maps the colors to the corresponding genres.
- **Data Points**: Each point represents a single genre, with its position determined by the number of data points in that genre.
### Detailed Analysis
- **Valid Set**: The data points are more densely packed, indicating a higher concentration of genres in this set.
- **Test Set**: The data points are more spread out, suggesting a lower concentration of genres in this set.
### Key Observations
- **Blues**: The highest number of data points, indicating a strong presence in the Valid Set.
- **Rock**: The second highest number of data points, also present in the Valid Set.
- **Disco**: Present in both sets, but with fewer data points than Blues and Rock.
- **Jazz**: Present in both sets, but with fewer data points than Blues and Rock.
- **Pop**: Present in both sets, but with fewer data points than Blues and Rock.
- **Country**: Present in both sets, but with fewer data points than Blues and Rock.
- **Metal**: Present in both sets, but with fewer data points than Blues and Rock.
- **Hip Hop**: Present in both sets, but with fewer data points than Blues and Rock.
- **Reggae**: Present in both sets, but with fewer data points than Blues and Rock.
- **Classical**: Present in both sets, but with fewer data points than Blues and Rock.
### Interpretation
The scatter plot suggests that the "Valid Set" has a more diverse distribution of music genres compared to the "Test Set." This could indicate that the "Valid Set" is a more representative sample of the music genre distribution. The "Test Set" may have been used to evaluate the performance of a model or algorithm in predicting genre distribution. The presence of fewer data points for some genres in the "Test Set" could suggest that the model is less accurate in predicting the genre distribution for those genres.