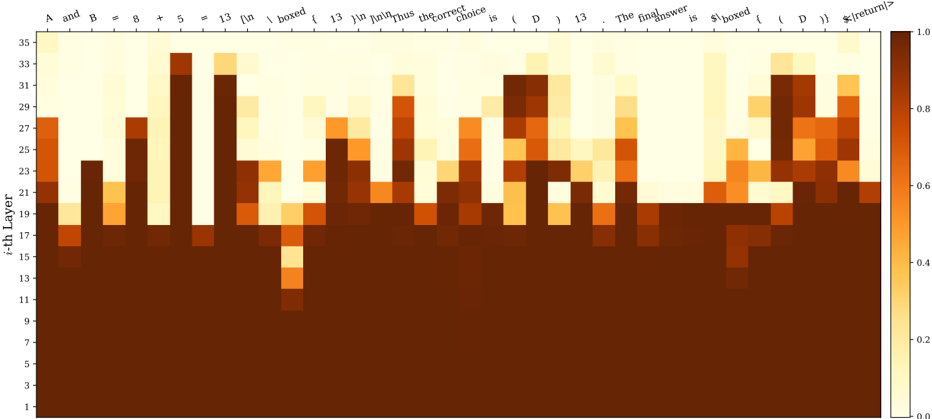
## Heatmap: Mathematical Expression Attention/Activation Pattern
### Overview
The image displays a heatmap visualizing numerical values across two dimensions: a sequence of text tokens (forming a mathematical expression) on the horizontal axis and layer indices (1 through 35) on the vertical axis. The color intensity represents a value between 0.0 and 1.0, as indicated by the color scale on the right. The overall pattern suggests a visualization of attention weights, activation strengths, or some form of processing intensity within a multi-layer model (likely a neural network) as it processes the given text sequence.
### Components/Axes
* **Chart Type:** Heatmap.
* **X-Axis (Top):** A sequence of text tokens forming a mathematical expression. The tokens are, from left to right:
`A`, `and`, `B`, `=`, `5`, `+`, `13`, `\boxed{`, `13`, `+`, `13`, `=`, `26`, `}`, `.`, `Thus`, `the`, `correct`, `choice`, `is`, `\boxed{`, `D`, `}`, `.`. The final token appears to be `<|return|>`.
* **Y-Axis (Left):** Labeled "i-th Layer". It is a linear scale with major tick marks at odd numbers from 1 to 35 (1, 3, 5, ..., 35).
* **Color Scale (Right):** A vertical bar indicating the mapping from color to numerical value. The scale ranges from 0.0 (light cream/yellow) to 1.0 (dark brown). Major tick marks are at 0.0, 0.2, 0.4, 0.6, 0.8, and 1.0. The gradient is continuous between these points.
* **Data Grid:** The main area is a grid where each cell's color corresponds to the value for a specific token (column) at a specific layer (row).
### Detailed Analysis
The heatmap reveals a distinct, non-uniform pattern of values across layers and tokens.
* **Layer 1-10 (Bottom Region):** This entire horizontal band is uniformly dark brown, indicating values at or very near 1.0 for all tokens across these initial layers. There is no visible variation.
* **Layer 11-35 (Upper Region):** This area shows significant variation. The pattern is characterized by vertical "columns" of higher intensity (darker orange/brown) corresponding to specific tokens, interspersed with areas of lower intensity (lighter yellow/cream).
* **High-Intensity Columns:** Tokens like the first `A`, the first `13` (inside `\boxed{`), the second `13`, the `26`, the `D` (inside `\boxed{`), and the final `<|return|>` show prominent vertical streaks of high values (0.6-1.0) extending from around layer 11 up to layer 35. The intensity within these columns often peaks in the middle layers (e.g., layers 15-25) before slightly fading in the highest layers.
* **Low-Intensity Columns:** Tokens such as `and`, `=`, `+`, `}`, `.`, `Thus`, `the`, `correct`, `choice`, `is`, and the second `.` are predominantly light-colored (values 0.0-0.4) across most upper layers, with only faint or sporadic patches of higher value.
* **Notable Anomalies:** The token `\boxed{` (the first one) shows a unique pattern: a very high-intensity spot (dark brown) at layer 11, which then sharply drops to low intensity for several layers before rising again. The token `13` (the one following the first `\boxed{`) has a column of high intensity that is notably narrower than others.
### Key Observations
1. **Bifurcated Processing:** There is a clear dichotomy between the first ~10 layers (uniform high activation) and the subsequent layers (selective, token-specific activation).
2. **Content-Driven Activation:** In the upper layers, the model's "attention" or processing strength is highly focused on specific, semantically or mathematically significant tokens: the variables (`A`, `B`), the numbers (`5`, `13`, `26`), the final answer (`D`), and the structural `\boxed{}` commands. Function words and punctuation are largely ignored.
3. **Peak in Mid-Upper Layers:** For the important tokens, the highest values (darkest colors) are not at the very top layers (30-35) but are concentrated in the middle of the upper stack (approximately layers 15-25).
4. **Structural Marker Response:** The `\boxed{}` tokens, which denote the answer container in mathematical text, elicit a strong but complex response, suggesting the model recognizes their special syntactic role.
### Interpretation
This heatmap likely visualizes the internal state (e.g., attention weights or neuron activations) of a large language model processing a step-by-step math problem. The data suggests a two-phase processing strategy:
1. **Initial Encoding (Layers 1-10):** The uniform high values indicate these early layers are broadly engaged in processing all input tokens equally, likely performing low-level feature extraction and embedding.
2. **Selective Reasoning (Layers 11-35):** The model shifts to a focused mode. It allocates significant computational resources (high values) to tokens that are crucial for solving the problem: the given numbers, the operations, and the final answer placeholder. The low values for connective words show the model filters out less relevant information. The peak activation in mid-layers may correspond to the core reasoning steps, while the slight fade in the highest layers could represent the consolidation of the result into the final output format.
The pattern demonstrates how a trained model dynamically allocates its processing capacity, concentrating on content-bearing elements to perform a logical deduction. The anomaly with the first `\boxed{` might indicate a specific sub-process for recognizing the start of an answer field.