\n
## Diagram: Matrix Decomposition Illustration
### Overview
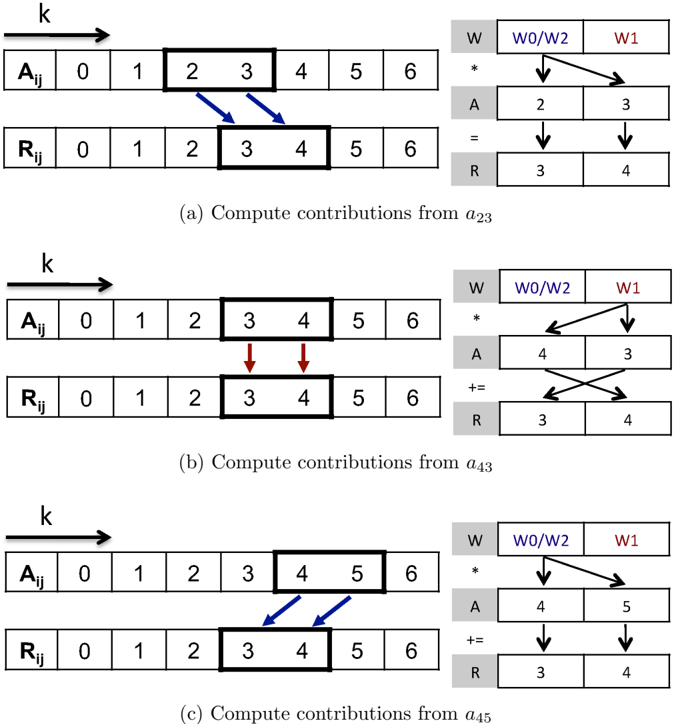
The image presents a series of three diagrams illustrating a matrix decomposition process, likely related to collaborative filtering or a similar technique. Each diagram shows two matrices, denoted as A<sub>ij</sub> and R<sub>ij</sub>, along with a calculation involving a vector W. The diagrams demonstrate how elements of matrix R are updated based on elements of matrix A and vector W.
### Components/Axes
Each diagram consists of:
* **Matrix A<sub>ij</sub>**: A 7x7 matrix with row and column indices ranging from 0 to 6. The horizontal axis is labeled "k".
* **Matrix R<sub>ij</sub>**: A 7x7 matrix with row and column indices ranging from 0 to 6.
* **Vector W**: A vector with elements W0, W1, and W2.
* **Arrows**: Blue arrows indicate the elements of A<sub>ij</sub> used in the calculation. Red arrows indicate the elements of R<sub>ij</sub> being updated.
* **Calculation Block**: A block showing the multiplication and addition operations performed using elements from A<sub>ij</sub>, R<sub>ij</sub>, and W.
* **Sub-captions**: Each diagram has a caption indicating which elements of A are being used for the computation: (a) a<sub>23</sub>, (b) a<sub>43</sub>, (c) a<sub>45</sub>.
### Detailed Analysis or Content Details
**Diagram (a): Compute contributions from a<sub>23</sub>**
* **Matrix A<sub>ij</sub>**: Values are not explicitly shown, but the cells are shaded.
* **Matrix R<sub>ij</sub>**: Values are not explicitly shown, but the cells are shaded.
* **Calculation Block**:
* A = 2 (bottom left)
* R = 3 (bottom right)
* W = [W0/W2, W1] (top)
* The calculation shows A multiplied by W0/W2, resulting in 2, and added to R, resulting in 3.
**Diagram (b): Compute contributions from a<sub>43</sub>**
* **Matrix A<sub>ij</sub>**: Values are not explicitly shown, but the cells are shaded.
* **Matrix R<sub>ij</sub>**: Values are not explicitly shown, but the cells are shaded.
* **Calculation Block**:
* A = 4 (bottom left)
* R = 3 (bottom right)
* W = [W0/W2, W1] (top)
* The calculation shows A multiplied by W0/W2, resulting in 4, and added to R, resulting in 3.
**Diagram (c): Compute contributions from a<sub>45</sub>**
* **Matrix A<sub>ij</sub>**: Values are not explicitly shown, but the cells are shaded.
* **Matrix R<sub>ij</sub>**: Values are not explicitly shown, but the cells are shaded.
* **Calculation Block**:
* A = 4 (bottom left)
* R = 3 (bottom right)
* W = [W0/W2, W1] (top)
* The calculation shows A multiplied by W0/W2, resulting in 4, and added to R, resulting in 3.
### Key Observations
* The diagrams illustrate an iterative process where elements of R are updated based on corresponding elements of A and a weight vector W.
* The calculation involves multiplying an element of A by W0/W2 and adding it to the corresponding element of R.
* The specific elements of A used in each diagram (a<sub>23</sub>, a<sub>43</sub>, a<sub>45</sub>) suggest a specific order or pattern in the decomposition process.
* The values in the calculation blocks (A=2, R=3, A=4, R=3, A=4, R=3) are consistent across the diagrams, but the specific elements of A being used change.
### Interpretation
The diagrams demonstrate a step in a matrix factorization or decomposition algorithm. The matrix A likely represents user-item interactions or preferences, while R is an intermediate matrix being constructed. The vector W represents weights or factors used in the decomposition. The process shown involves updating elements of R by incorporating information from A, weighted by W. This is a common technique in collaborative filtering, where the goal is to predict missing values in A (e.g., user preferences for items they haven't rated) by decomposing A into lower-dimensional matrices. The specific choice of elements (a<sub>23</sub>, a<sub>43</sub>, a<sub>45</sub>) and the consistent values in the calculation blocks suggest a specific implementation or optimization strategy within the algorithm. The use of W0/W2 suggests a potential normalization or scaling factor. The diagrams are illustrative and do not provide specific numerical values for the matrix elements, but they clearly demonstrate the underlying process of updating R based on A and W.