## Diagram: Contribution Computation Process
### Overview
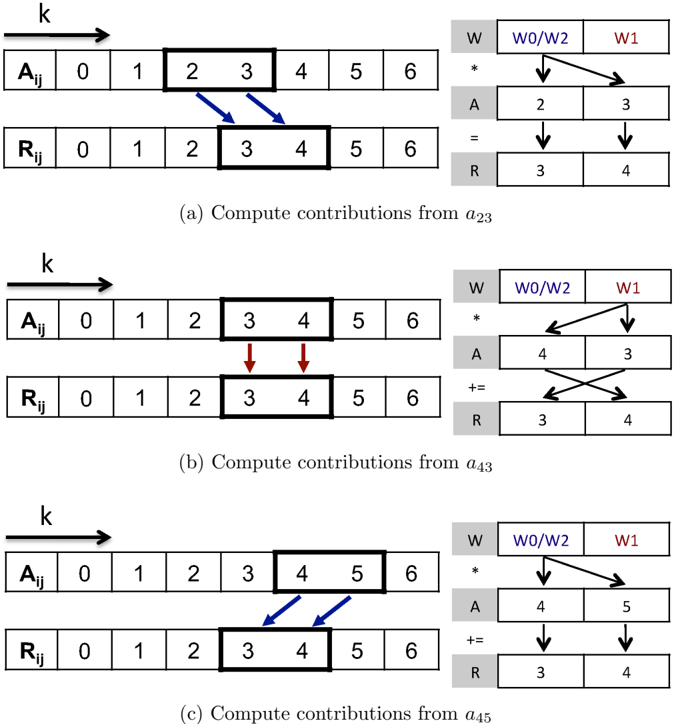
The diagram illustrates a three-step computational process for calculating contributions from specific elements (a23, a43, a45) using weighted operations. Each step involves selecting numerical ranges, applying transformations (W0/W2, W1), and combining results through arithmetic operations (*=, +=). The process is visualized through horizontal rows (A_ij, R_ij), highlighted boxes, and directional arrows.
### Components/Axes
- **Rows**:
- **A_ij**: Top row with indices 0–6, labeled with "k" (horizontal axis).
- **R_ij**: Bottom row with indices 0–6, also labeled with "k".
- **Highlighted Boxes**:
- **(a)**: Boxes around indices 2–3 in A_ij and 3–4 in R_ij.
- **(b)**: Boxes around indices 3–4 in A_ij and 3–4 in R_ij.
- **(c)**: Boxes around indices 4–5 in A_ij and 3–4 in R_ij.
- **Legend (Right Side)**:
- **Symbols**:
- `*`: Represents multiplication (W0/W2).
- `+=`: Represents addition (W1).
- **Labels**:
- **W0/W2**: Weighted operation for multiplication.
- **W1**: Weighted operation for addition.
- **A**: Intermediate result (A_ij).
- **R**: Final result (R_ij).
- **Operations**:
- `*=`: Multiplication assignment.
- `+=`: Addition assignment.
### Detailed Analysis
#### Step (a): Compute contributions from a23
- **Highlighted Ranges**:
- A_ij: Indices 2–3 (values 2, 3).
- R_ij: Indices 3–4 (values 3, 4).
- **Arrows**:
- Blue arrows from A_ij[2–3] point to W0/W2 (multiplication).
- Red arrows from R_ij[3–4] point to W1 (addition).
- **Operations**:
- A_ij[2–3] undergoes `*=` with W0/W2.
- R_ij[3–4] undergoes `+=` with W1.
#### Step (b): Compute contributions from a43
- **Highlighted Ranges**:
- A_ij: Indices 3–4 (values 3, 4).
- R_ij: Indices 3–4 (values 3, 4).
- **Arrows**:
- Blue arrows from A_ij[3–4] point to W0/W2.
- Red arrows from R_ij[3–4] point to W1.
- **Operations**:
- A_ij[3–4] undergoes `*=` with W0/W2.
- R_ij[3–4] undergoes `+=` with W1.
#### Step (c): Compute contributions from a45
- **Highlighted Ranges**:
- A_ij: Indices 4–5 (values 4, 5).
- R_ij: Indices 3–4 (values 3, 4).
- **Arrows**:
- Blue arrows from A_ij[4–5] point to W0/W2.
- Red arrows from R_ij[3–4] point to W1.
- **Operations**:
- A_ij[4–5] undergoes `*=` with W0/W2.
- R_ij[3–4] undergoes `+=` with W1.
### Key Observations
1. **Sequential Processing**: Each step processes distinct ranges of A_ij and R_ij, with overlapping contributions in R_ij (indices 3–4 appear in all steps).
2. **Weighted Operations**:
- Multiplication (`*=` with W0/W2) applies to A_ij ranges.
- Addition (`+=` with W1) applies to R_ij ranges.
3. **Cumulative Effect**: R_ij[3–4] is modified in all three steps, suggesting it accumulates results across iterations.
### Interpretation
The diagram represents a **weighted aggregation algorithm** where contributions from specific element pairs (a23, a43, a45) are computed by:
1. Selecting relevant indices in A_ij and R_ij.
2. Applying element-wise multiplication (W0/W2) to A_ij ranges.
3. Accumulating results via addition (W1) to R_ij ranges.
4. The repeated modification of R_ij[3–4] implies it acts as a **central accumulator** for contributions from overlapping element pairs.
This process could model scenarios like:
- **Graph-based computations** (e.g., edge weight aggregation in networks).
- **Signal processing** (e.g., feature weighting in time-series data).
- **Machine learning** (e.g., attention mechanisms in transformers).
The use of W0/W2 and W1 suggests **conditional weighting** based on element properties, while the directional arrows emphasize **data flow dependencies** between steps.