\n
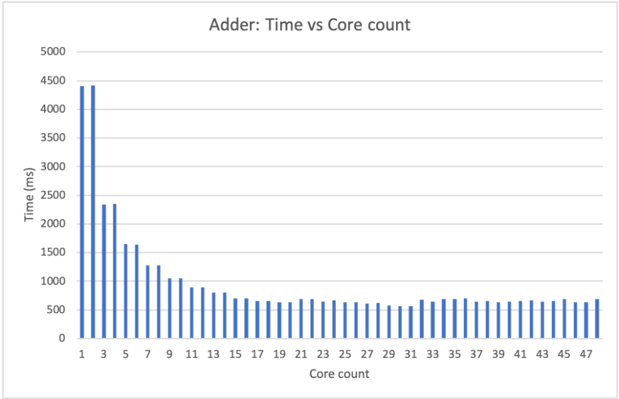
## Bar Chart: Adder - Time vs Core count
### Overview
The image presents a bar chart illustrating the relationship between core count and execution time (in milliseconds) for an operation named "Adder". The chart displays a clear inverse relationship: as the core count increases, the execution time decreases, but the rate of decrease diminishes significantly after a certain point.
### Components/Axes
* **Title:** "Adder: Time vs Core count" - positioned at the top-center of the chart.
* **X-axis:** "Core count" - ranging from 1 to 47, with increments of 1. The axis is labeled at the bottom of the chart.
* **Y-axis:** "Time (ms)" - ranging from 0 to 5000, with increments of 500. The axis is labeled on the left side of the chart.
* **Data Series:** A single series of blue bars representing the execution time for each core count.
* **Gridlines:** Horizontal gridlines are present to aid in reading the values on the Y-axis.
### Detailed Analysis
The chart shows a steep decline in execution time as the core count increases from 1 to approximately 7. Beyond this point, the decrease in execution time becomes less pronounced, eventually leveling off around a core count of 25.
Here's a breakdown of approximate values, reading from the chart:
* Core Count 1: ~4500 ms
* Core Count 3: ~2100 ms
* Core Count 5: ~1400 ms
* Core Count 7: ~1000 ms
* Core Count 9: ~900 ms
* Core Count 11: ~800 ms
* Core Count 13: ~700 ms
* Core Count 15: ~650 ms
* Core Count 17: ~600 ms
* Core Count 19: ~550 ms
* Core Count 21: ~500 ms
* Core Count 23: ~475 ms
* Core Count 25: ~450 ms
* Core Count 27: ~425 ms
* Core Count 29: ~400 ms
* Core Count 31: ~375 ms
* Core Count 33: ~350 ms
* Core Count 35: ~325 ms
* Core Count 37: ~300 ms
* Core Count 39: ~275 ms
* Core Count 41: ~250 ms
* Core Count 43: ~225 ms
* Core Count 45: ~200 ms
* Core Count 47: ~175 ms
The trend is a rapid initial decrease, followed by diminishing returns as more cores are added.
### Key Observations
* The most significant performance gains are achieved with a relatively small number of cores (1-7).
* Adding cores beyond 25 yields only marginal improvements in execution time.
* There appears to be a limit to the performance improvement achievable by increasing the core count for this specific "Adder" operation.
### Interpretation
The data suggests that the "Adder" operation benefits from parallelization, as evidenced by the initial decrease in execution time with increasing core count. However, the diminishing returns indicate that the operation is likely limited by factors other than the number of available cores, such as memory bandwidth, data dependencies, or the overhead of managing parallel threads. The leveling off of the curve suggests that the operation has reached a point of diminishing returns with respect to core count. Further increasing the core count would likely not result in substantial performance improvements, and could even introduce overhead that degrades performance. This type of behavior is common in parallel computing, where the ideal speedup is limited by Amdahl's Law. The chart provides valuable insight into the scalability of the "Adder" operation and can inform decisions about hardware resource allocation and algorithm optimization.