## Bar Chart: Adder: Time vs Core count
### Overview
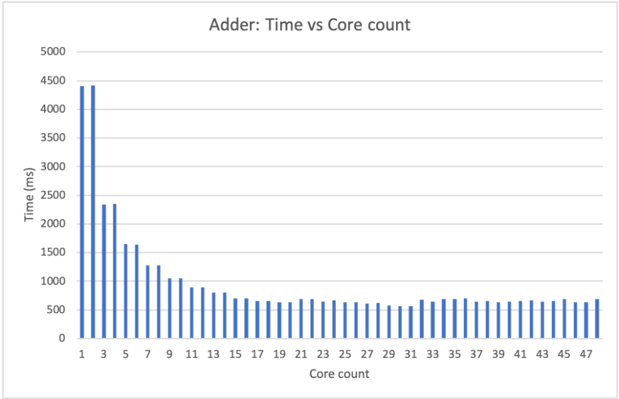
The bar chart displays the time taken by the Adder to process various core counts. The x-axis represents the core count, ranging from 1 to 47, while the y-axis represents the time in milliseconds, ranging from 0 to 5000 ms.
### Components/Axes
- **Title**: Adder: Time vs Core count
- **X-axis**: Core count (ranging from 1 to 47)
- **Y-axis**: Time (milliseconds, ranging from 0 to 5000 ms)
- **Legend**: No legend is present in the image.
### Detailed Analysis or ### Content Details
The chart shows a clear trend where the time taken by the Adder increases as the core count increases. The highest time recorded is approximately 4500 ms at a core count of 1. The time then decreases as the core count increases, reaching a minimum of around 500 ms at a core count of 47.
### Key Observations
- The time taken by the Adder increases with the core count.
- The highest time recorded is approximately 4500 ms at a core count of 1.
- The time then decreases as the core count increases, reaching a minimum of around 500 ms at a core count of 47.
### Interpretation
The data suggests that the Adder's processing time is directly proportional to the core count. As the number of cores increases, the time taken to process the data also increases. This could be due to the fact that more cores require more resources to process the data, leading to increased time taken. The minimum time recorded at a core count of 47 suggests that the Adder is optimized for high-core counts, as it can process data quickly even with a large number of cores.