\n
## Diagram: Policy-Environment Interaction
### Overview
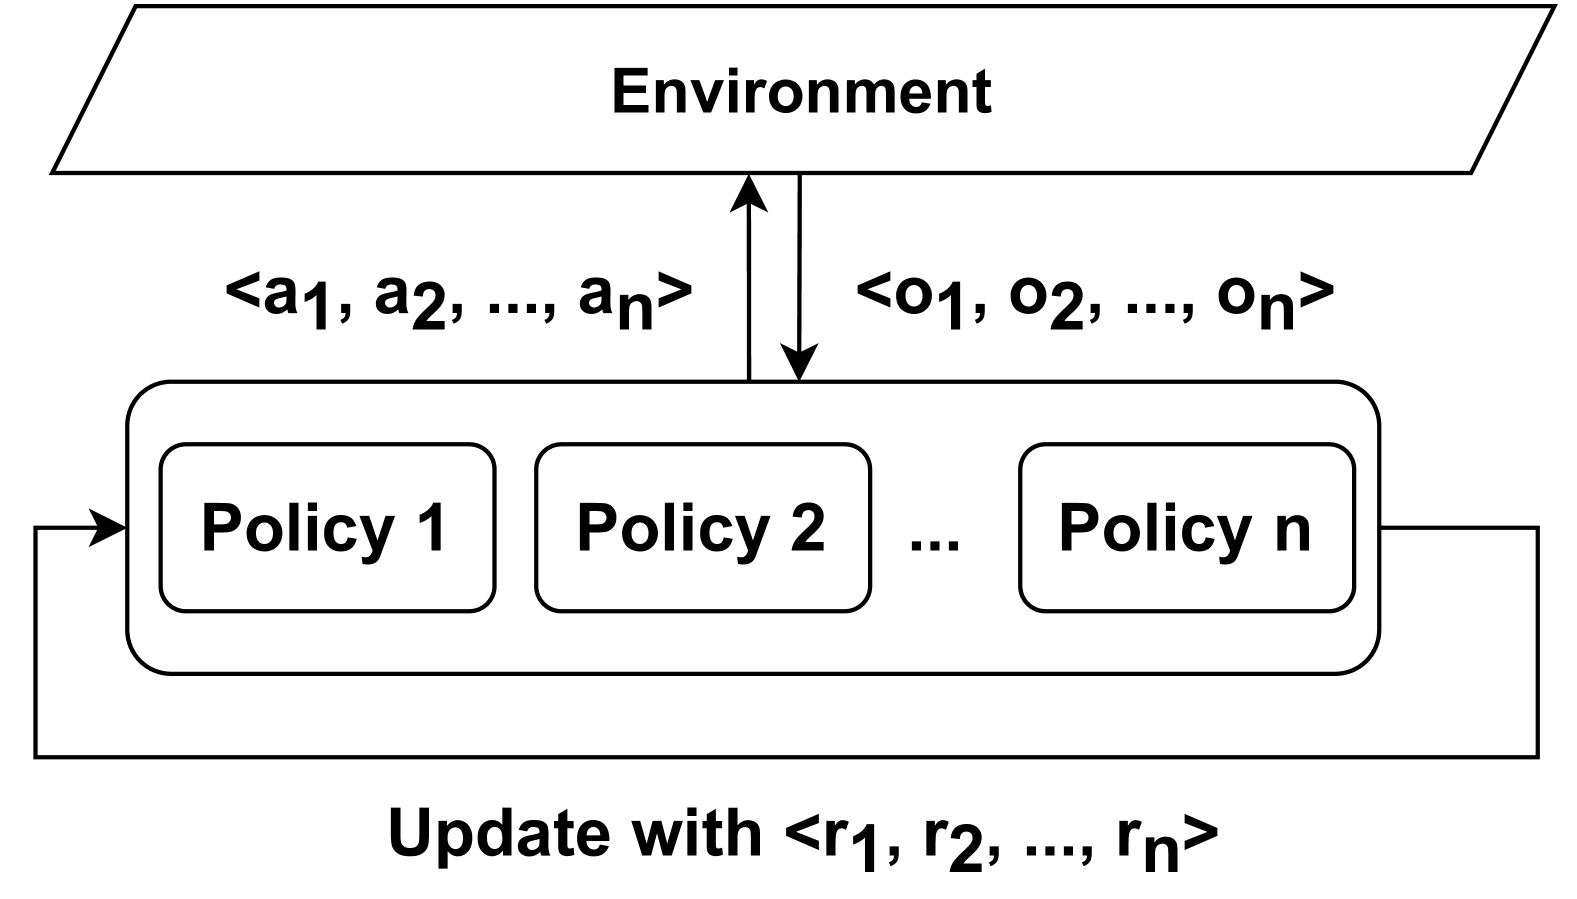
The image depicts a diagram illustrating the interaction between an "Environment" and a set of "Policies". It represents a feedback loop where the environment provides inputs to the policies, and the policies, in turn, update based on the environment's output.
### Components/Axes
The diagram consists of the following components:
* **Environment:** A large, grey rectangle at the top, labeled "Environment" in black text.
* **Policies:** A set of smaller, rounded rectangles arranged horizontally within a larger rectangle, labeled "Policy 1", "Policy 2", ..., "Policy n".
* **Input from Environment:** An arrow pointing from the "Environment" to the "Policies", labeled "<a1, a2, ..., an>".
* **Output from Policies:** An arrow pointing from the "Policies" to the "Environment", labeled "<o1, o2, ..., on>".
* **Update:** Text below the "Policies" rectangle, labeled "Update with <r1, r2, ..., rn>".
* **External Input/Output:** Arrows entering and exiting the entire system on the left and right sides, indicating external interaction.
### Detailed Analysis
The diagram shows a closed-loop system. The "Environment" provides a set of inputs, represented as a vector `<a1, a2, ..., an>`, to the "Policies". The "Policies" process these inputs and generate outputs, represented as a vector `<o1, o2, ..., on>`, which are then fed back into the "Environment". The "Policies" are updated based on a set of rewards or signals, represented as a vector `<r1, r2, ..., rn>`.
The diagram suggests that there are 'n' number of policies. The input and output vectors both contain 'n' elements, indicating a one-to-one correspondence between inputs and outputs. The update vector also contains 'n' elements, suggesting that each policy is updated individually.
### Key Observations
The diagram is abstract and does not provide specific values or numerical data. It focuses on the conceptual flow of information and interaction between the "Environment" and the "Policies". The use of vectors `<...>` suggests a mathematical or computational representation of the inputs, outputs, and updates.
### Interpretation
This diagram likely represents a reinforcement learning or control system. The "Environment" represents the world or system being controlled, and the "Policies" represent the agents or algorithms that are learning to interact with the environment. The inputs `<a1, a2, ..., an>` could represent observations or states of the environment, the outputs `<o1, o2, ..., on>` could represent actions taken by the policies, and the updates `<r1, r2, ..., rn>` could represent rewards or penalties received for those actions.
The diagram highlights the iterative nature of learning and control. The policies continuously interact with the environment, receive feedback, and update their behavior to improve their performance. The use of vectors suggests that the system is dealing with multiple variables or dimensions simultaneously. The diagram is a high-level representation and does not specify the details of how the policies are implemented or how the updates are calculated.