## Diagram: Policy-Environment Interaction System
### Overview
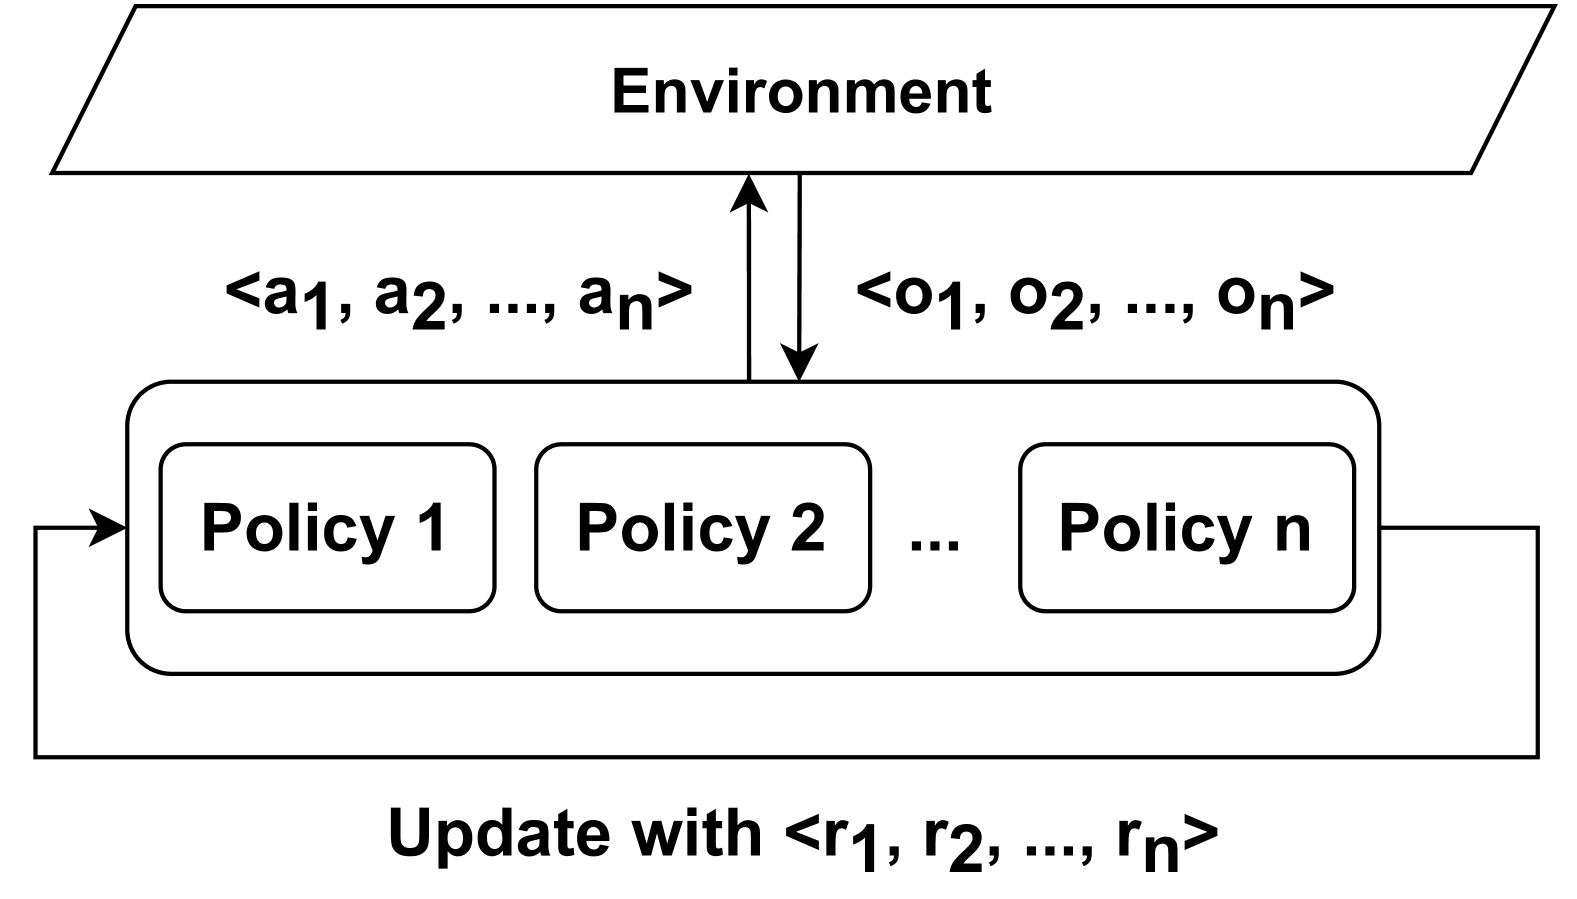
The diagram illustrates a multi-policy system interacting with an environment. It shows bidirectional data flow between the environment and multiple policy components, with an update mechanism at the bottom. The system uses labeled input/output sequences and reward signals.
### Components/Axes
1. **Environment** (Top rectangle):
- Inputs: `<a1, a2, ..., an>` (action sequence)
- Outputs: `<o1, o2, ..., on>` (observation sequence)
- Position: Top of diagram, connected via bidirectional arrow to policies
2. **Policy Components** (Central block):
- Labeled sequentially: Policy 1, Policy 2, ..., Policy n
- Arranged horizontally in a single row
- Connected via rightward arrows between policies
- Connected to Environment via upward/downward arrows
3. **Update Mechanism** (Bottom label):
- Text: "Update with <r1, r2, ..., rn>"
- Position: Bottom of diagram, connected via bidirectional arrow to policies
### Detailed Analysis
- **Data Flow**:
- Environment provides action sequences (`a1...an`) to policies
- Policies generate observation sequences (`o1...on`) fed back to Environment
- Reward signals (`r1...rn`) flow from policies to update mechanism
- Update mechanism sends updated parameters back to policies
- **Component Relationships**:
- Environment acts as central data source/sink
- Policies form interconnected processing units
- Update mechanism serves as feedback loop for policy improvement
### Key Observations
1. System uses sequential data structures (action/observation/reward sequences)
2. No explicit numerical values provided - all sequences represented symbolically
3. Bidirectional arrows suggest real-time interaction between components
4. "n" notation indicates scalable system architecture (variable number of policies)
### Interpretation
This appears to represent a reinforcement learning framework where:
- The Environment provides state/action feedback
- Multiple policies (agents) process environmental data
- Reward signals (`r1...rn`) drive policy updates
- The system architecture supports distributed policy learning/optimization
The lack of numerical values suggests this is a conceptual architecture diagram rather than an empirical results visualization. The use of ellipses (...) implies the system can scale horizontally with additional policies while maintaining the same interaction pattern.