## Scatter Plot: Music Genre Clustering
### Overview
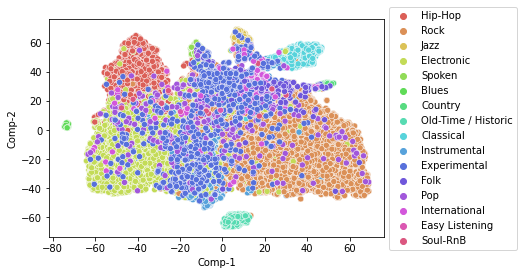
The image is a 2D scatter plot visualizing the clustering of music genres based on two principal components (Comp-1 and Comp-2). Each point represents a song, with colors corresponding to specific genres. The plot reveals distinct groupings and overlaps between genres, suggesting shared characteristics or overlaps in their feature spaces.
### Components/Axes
- **X-axis (Comp-1)**: Ranges from -80 to 60.
- **Y-axis (Comp-2)**: Ranges from -60 to 60.
- **Legend**: Located in the top-right corner, mapping 15 genres to distinct colors (e.g., Hip-Hop = red, Rock = orange, Jazz = yellow, etc.).
### Detailed Analysis
- **Hip-Hop (red)**: Clustered in the top-left quadrant (Comp-1 ≈ -60 to -40, Comp-2 ≈ 40 to 60).
- **Rock (orange)**: Dominates the right half (Comp-1 ≈ 20 to 60, Comp-2 ≈ -20 to 40).
- **Jazz (yellow)**: Centered-right (Comp-1 ≈ 20 to 40, Comp-2 ≈ -20 to 20).
- **Electronic (light green)**: Center-left (Comp-1 ≈ -20 to 0, Comp-2 ≈ -20 to 20).
- **Spoken (dark green)**: Isolated point at (-60, 0).
- **Blues (green)**: Top-left, overlapping with Hip-Hop (Comp-1 ≈ -60 to -40, Comp-2 ≈ 40 to 60).
- **Country (light blue)**: Top-center (Comp-1 ≈ 0 to 20, Comp-2 ≈ 40 to 60).
- **Old-Time/Historic (cyan)**: Top-right (Comp-1 ≈ 20 to 40, Comp-2 ≈ 40 to 60).
- **Classical (blue)**: Center (Comp-1 ≈ -20 to 20, Comp-2 ≈ -20 to 20).
- **Instrumental (dark blue)**: Center-left (Comp-1 ≈ -20 to 0, Comp-2 ≈ -20 to 20).
- **Experimental (purple)**: Center (Comp-1 ≈ -20 to 20, Comp-2 ≈ -20 to 20).
- **Folk (dark purple)**: Center-right (Comp-1 ≈ 20 to 40, Comp-2 ≈ -20 to 20).
- **Pop (light purple)**: Center (Comp-1 ≈ -20 to 20, Comp-2 ≈ -20 to 20).
- **International (pink)**: Center-right (Comp-1 ≈ 20 to 40, Comp-2 ≈ -20 to 20).
- **Easy Listening (light pink)**: Center (Comp-1 ≈ -20 to 20, Comp-2 ≈ -20 to 20).
- **Soul-RnB (dark red)**: Center-left (Comp-1 ≈ -20 to 0, Comp-2 ≈ -20 to 20).
### Key Observations
1. **Distinct Clusters**:
- Hip-Hop, Blues, and Country form tight clusters in the top-left and top-center regions.
- Rock, Folk, and Jazz occupy the right and center-right areas.
- Spoken is an outlier, isolated at (-60, 0).
2. **Overlaps**:
- Hip-Hop and Blues overlap significantly in the top-left.
- Electronic, Instrumental, and Soul-RnB cluster near the center-left.
- Pop, Easy Listening, and Experimental are dispersed across the center.
3. **Spread**:
- The largest spread occurs along Comp-1 (horizontal axis), with Rock and Jazz extending farthest to the right.
- Comp-2 (vertical axis) shows moderate spread, with Hip-Hop and Country reaching the highest values.
### Interpretation
The plot demonstrates how music genres cluster based on shared features (e.g., instrumentation, rhythm, lyrical themes). For example:
- **Hip-Hop and Blues** share a top-left position, suggesting similarities in rhythmic or lyrical patterns.
- **Rock and Folk** occupy the right side, possibly indicating shared acoustic or storytelling elements.
- **Spoken**’s isolation implies it is distinct from other genres, likely due to its focus on vocal delivery without musical accompaniment.
- **Country and Old-Time/Historic** cluster together, reflecting historical or regional influences.
The principal components (Comp-1 and Comp-2) capture the most significant variance in the dataset, enabling clear genre differentiation. Outliers like Spoken highlight unique characteristics, while overlaps (e.g., Hip-Hop/Blues) suggest hybrid or transitional genres. This visualization could inform recommendations, genre analysis, or algorithmic music categorization.