## Box Plot: Test Accuracy vs. Number of Odorants (N_OR) for Chemical Combinations
### Overview
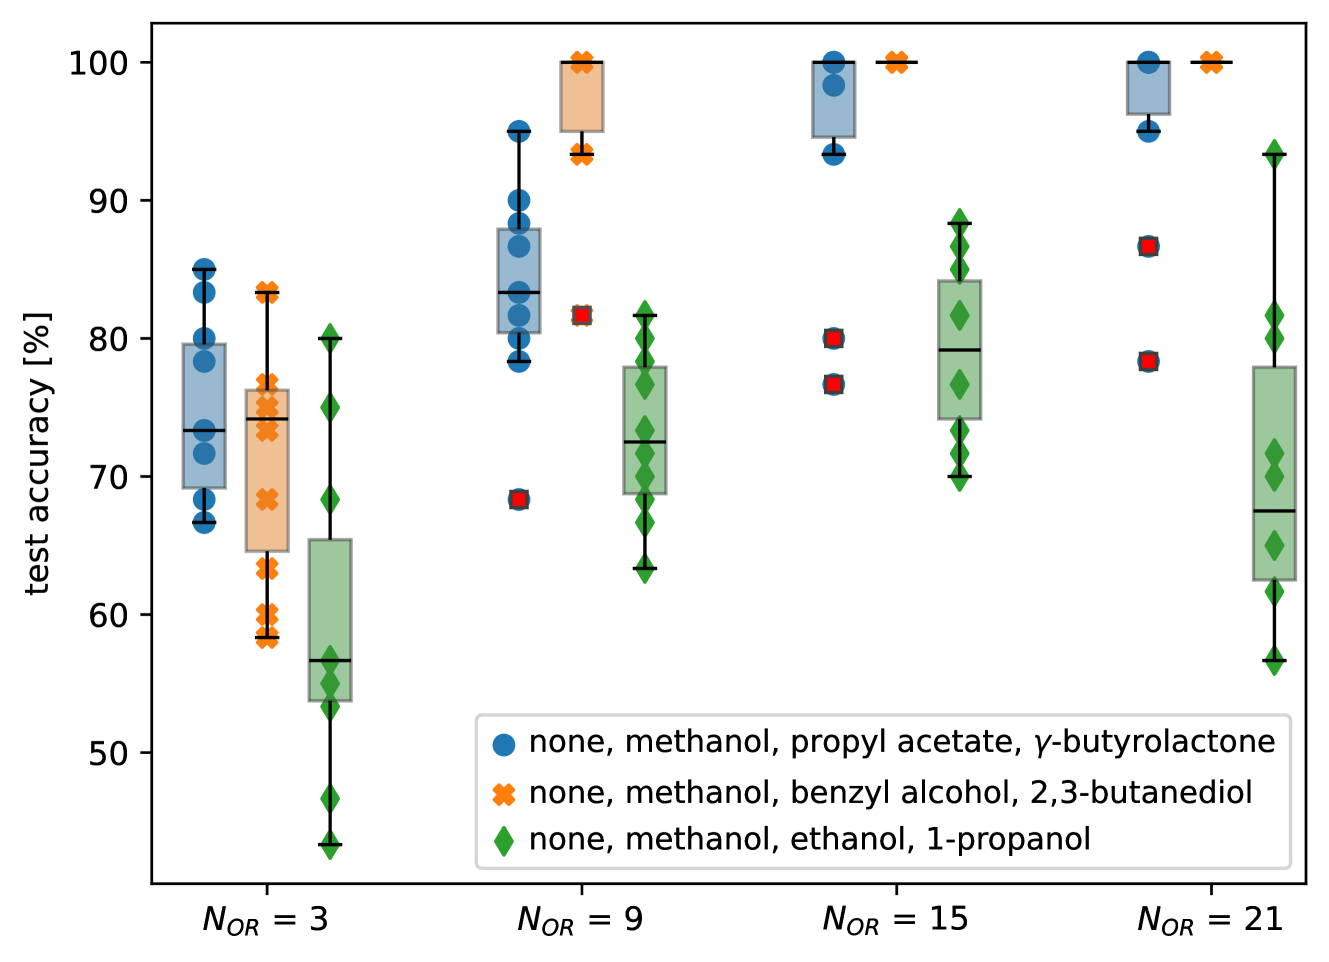
The image is a comparative box plot showing test accuracy percentages (y-axis: 50–100%) across four odorant group sizes (N_OR = 3, 9, 15, 21) for three chemical combinations. Each group is represented by distinct markers and colors: blue circles (none, methanol, propyl acetate, γ-butyrolactone), orange crosses (none, methanol, benzyl alcohol, 2,3-butanediol), and green diamonds (none, methanol, ethanol, 1-propanol). The legend is positioned at the bottom-right corner.
### Components/Axes
- **X-axis**: N_OR values (3, 9, 15, 21), labeled as "N_OR = [value]".
- **Y-axis**: Test accuracy (%) ranging from 50 to 100.
- **Legend**: Located at the bottom-right, mapping colors/markers to chemical combinations:
- Blue circles: none, methanol, propyl acetate, γ-butyrolactone
- Orange crosses: none, methanol, benzyl alcohol, 2,3-butanediol
- Green diamonds: none, methanol, ethanol, 1-propanol
### Detailed Analysis
1. **N_OR = 3**:
- **Blue circles**: Median ~75%, range 65–85%, outliers at ~60% and ~80%.
- **Orange crosses**: Median ~70%, range 60–75%, outliers at ~55% and ~70%.
- **Green diamonds**: Median ~65%, range 55–70%, outliers at ~50% and ~75%.
2. **N_OR = 9**:
- **Blue circles**: Median ~85%, range 80–90%, outliers at ~80% and ~95%.
- **Orange crosses**: Median ~80%, range 75–85%, outliers at ~70% and ~85%.
- **Green diamonds**: Median ~70%, range 65–75%, outliers at ~60% and ~80%.
3. **N_OR = 15**:
- **Blue circles**: Median ~95%, range 90–100%, outliers at ~90% and ~100%.
- **Orange crosses**: Median ~85%, range 80–90%, outliers at ~75% and ~90%.
- **Green diamonds**: Median ~75%, range 70–80%, outliers at ~65% and ~85%.
4. **N_OR = 21**:
- **Blue circles**: Median ~98%, range 95–100%, outliers at ~90% and ~100%.
- **Orange crosses**: Median ~85%, range 80–90%, outliers at ~75% and ~95%.
- **Green diamonds**: Median ~70%, range 65–75%, outliers at ~60% and ~85%.
### Key Observations
- **Blue circles** (propyl acetate/γ-butyrolactone) show a consistent upward trend in median accuracy as N_OR increases, with reduced variability at higher N_OR.
- **Orange crosses** (benzyl alcohol/2,3-butanediol) exhibit a slight decline in median accuracy from N_OR=9 to N_OR=15, followed by stabilization.
- **Green diamonds** (ethanol/1-propanol) demonstrate stable medians across N_OR but with persistent outliers, particularly at N_OR=21 (~85%).
- Outliers for all groups are more frequent at lower N_OR values.
### Interpretation
The data suggests that increasing the number of odorants (N_OR) improves test accuracy for the propyl acetate/γ-butyrolactone combination, likely due to enhanced discriminative power. The benzyl alcohol/2,3-butanediol group shows diminishing returns or potential interference at higher N_OR. The ethanol/1-propanol combination remains inconsistent, with outliers indicating possible confounding factors (e.g., overlapping odorant profiles). The trend aligns with principles of olfactory discrimination, where complexity (N_OR) may enhance or hinder performance depending on chemical specificity.