# Sepsis Prediction Model (Test) Confusion Matrix Analysis
## Key Components
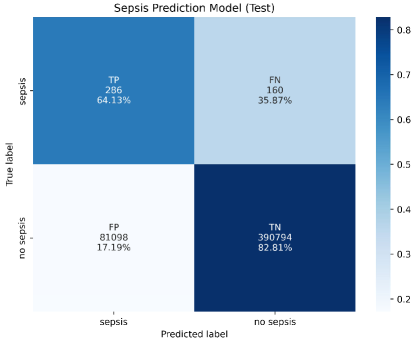
- **Title**: "Sepsis Prediction Model (Test)"
- **Axes**:
- **X-axis (Predicted label)**:
- Categories: "sepsis", "no sepsis"
- **Y-axis (True label)**:
- Categories: "sepsis", "no sepsis"
- **Legend**:
- Color bar ranging from **0.2** (light blue) to **0.8** (dark blue), representing prediction confidence or proportion.
## Data Structure
The matrix is divided into four quadrants, each representing a classification outcome:
1. **Top-left (TP - True Positive)**:
- **Count**: 286
- **Percentage**: 64.13% (of true sepsis cases)
2. **Top-right (FN - False Negative)**:
- **Count**: 160
- **Percentage**: 35.87% (of true sepsis cases)
3. **Bottom-left (FP - False Positive)**:
- **Count**: 81,098
- **Percentage**: 17.19% (of true no sepsis cases)
4. **Bottom-right (TN - True Negative)**:
- **Count**: 390,794
- **Percentage**: 82.81% (of true no sepsis cases)
## Color Scale Verification
- **Legend Position**: Right side of the matrix.
- **Color Matching**:
- **TN (dark blue)**: 0.8281 (matches darkest shade).
- **FP (light blue)**: 0.1719 (matches lightest shade in "no sepsis" row).
- **TP (medium blue)**: 0.6413 (intermediate shade).
- **FN (light blue)**: 0.3587 (intermediate shade in "sepsis" row).
## Trend Analysis
- **True Negatives (TN)**: Dominates the matrix (82.81%), indicating the model correctly predicts "no sepsis" most frequently.
- **False Positives (FP)**: High count (81,098) despite low percentage (17.19%), suggesting class imbalance (fewer true sepsis cases).
- **True Positives (TP)**: Moderate performance (64.13% of sepsis cases correctly identified).
- **False Negatives (FN)**: 35.87% of sepsis cases missed, highlighting potential risks in clinical settings.
## Spatial Grounding
- **Legend**: Right-aligned, vertical color bar.
- **Cell Colors**:
- **TN**: Dark blue (highest value).
- **FP**: Light blue (lowest value in "no sepsis" row).
- **TP**: Medium blue (intermediate value in "sepsis" row).
- **FN**: Light blue (intermediate value in "sepsis" row).
## Critical Observations
1. **Class Imbalance**:
- True no sepsis cases (TN + FP = 471,892) vastly outnumber true sepsis cases (TP + FN = 446).
2. **Model Bias**:
- High TN rate (82.81%) suggests the model is overly optimized for the majority class ("no sepsis").
3. **Clinical Implications**:
- High FN rate (35.87%) could lead to missed sepsis diagnoses, emphasizing the need for improved sensitivity.
## Data Table Reconstruction
| True Label \ Predicted Label | sepsis | no sepsis |
|------------------------------|--------------|--------------|
| **sepsis** | TP: 286 (64.13%) | FN: 160 (35.87%) |
| **no sepsis** | FP: 81,098 (17.19%) | TN: 390,794 (82.81%) |
## Conclusion
The model performs well in identifying "no sepsis" cases but struggles with sensitivity for sepsis detection. The high false positive rate in the "no sepsis" category may reflect dataset imbalance, while the false negative rate highlights a critical area for improvement in clinical applications.