# Technical Document Extraction: Sepsis Prediction Model (Test) Confusion Matrix
## 1. Document Overview
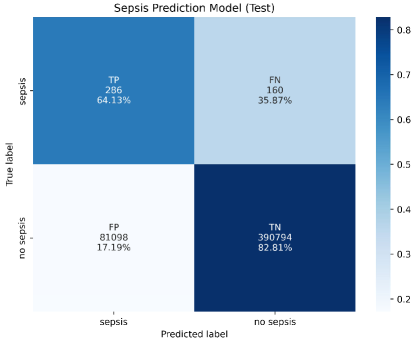
This image is a **Confusion Matrix** representing the performance of a "Sepsis Prediction Model" on a test dataset. It visualizes the relationship between the actual ground truth (True label) and the model's classifications (Predicted label).
## 2. Component Isolation
### Header
* **Title:** Sepsis Prediction Model (Test)
### Main Chart (Heatmap)
The chart is a 2x2 grid. The color intensity represents the normalized proportion of predictions within each true class row.
* **Y-Axis (True label):** Categories are "sepsis" (top) and "no sepsis" (bottom).
* **X-Axis (Predicted label):** Categories are "sepsis" (left) and "no sepsis" (right).
### Legend (Color Bar)
* **Location:** Right side of the chart.
* **Type:** Gradient scale (light blue to dark blue).
* **Range:** Approximately 0.2 to 0.8.
* **Function:** Indicates the normalized ratio of the row total. Darker blue indicates a higher percentage of correct or incorrect classifications relative to that specific true label.
## 3. Data Table Reconstruction
The following table transcribes the numerical data and labels found within the four quadrants of the matrix.
| True Label \ Predicted Label | sepsis (Predicted) | no sepsis (Predicted) | Row Totals (Calculated) |
| :--- | :--- | :--- | :--- |
| **sepsis (True)** | **TP (True Positive)**<br>Count: 286<br>Percentage: 64.13% | **FN (False Negative)**<br>Count: 160<br>Percentage: 35.87% | 446 |
| **no sepsis (True)** | **FP (False Positive)**<br>Count: 81,098<br>Percentage: 17.19% | **TN (True Negative)**<br>Count: 390,794<br>Percentage: 82.81% | 471,892 |
## 4. Trend and Data Analysis
### Trend Verification
* **True Sepsis Row:** The "TP" cell is a medium-dark blue, while the "FN" cell is a light blue. This indicates the model is more likely to correctly identify sepsis than to miss it when it is present.
* **True No Sepsis Row:** The "TN" cell is the darkest blue in the entire chart, while the "FP" cell is nearly white. This indicates a very high success rate in identifying the absence of sepsis, though the raw number of false positives is high due to class imbalance.
### Key Performance Metrics (Derived from Data)
* **Sensitivity (Recall):** 64.13% (The model correctly identifies roughly 2/3 of actual sepsis cases).
* **Specificity:** 82.81% (The model correctly identifies over 4/5 of non-sepsis cases).
* **Class Imbalance:** There is a massive disparity in the dataset size. There are only 446 "sepsis" instances compared to 471,892 "no sepsis" instances.
* **False Positive Impact:** While the FP rate is relatively low (17.19%), because the "no sepsis" population is so large, the model generated 81,098 false alarms, which significantly outweighs the 286 true positives.