## Bar Chart: Performance Comparison by Category
### Overview
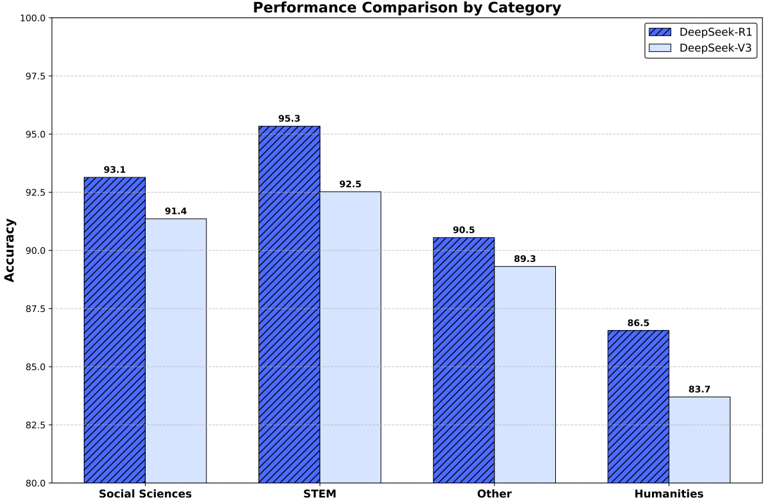
The chart compares the accuracy performance of two models, **DeepSeek-R1** (blue striped bars) and **DeepSeek-V3** (light blue bars), across four academic categories: Social Sciences, STEM, Other, and Humanities. Accuracy values are displayed on top of each bar, with the y-axis ranging from 80 to 100.
### Components/Axes
- **X-axis**: Categories (Social Sciences, STEM, Other, Humanities).
- **Y-axis**: Accuracy (80–100, increments of 2.5).
- **Legend**:
- Top-right corner.
- Blue striped bars: DeepSeek-R1.
- Light blue bars: DeepSeek-V3.
### Detailed Analysis
1. **Social Sciences**:
- DeepSeek-R1: 93.1 (dark blue striped bar).
- DeepSeek-V3: 91.4 (light blue bar).
2. **STEM**:
- DeepSeek-R1: 95.3 (dark blue striped bar).
- DeepSeek-V3: 92.5 (light blue bar).
3. **Other**:
- DeepSeek-R1: 90.5 (dark blue striped bar).
- DeepSeek-V3: 89.3 (light blue bar).
4. **Humanities**:
- DeepSeek-R1: 86.5 (dark blue striped bar).
- DeepSeek-V3: 83.7 (light blue bar).
### Key Observations
- **Consistent Outperformance**: DeepSeek-R1 achieves higher accuracy than DeepSeek-V3 in all categories.
- **Largest Gap in STEM**: R1 leads by 2.8 points (95.3 vs. 92.5).
- **Smallest Gap in Humanities**: R1 leads by 2.8 points (86.5 vs. 83.7).
- **Lowest Performance in Humanities**: Both models score below 90, with V3 at 83.7.
- **Gradual Decline in "Other"**: Both models show reduced accuracy compared to Social Sciences and STEM.
### Interpretation
The data demonstrates that **DeepSeek-R1 consistently outperforms DeepSeek-V3** across all academic categories, with the largest performance gap in STEM. This suggests R1 may have superior architectural or training optimizations for technical domains. The near-identical performance gaps in STEM and Humanities (both 2.8 points) imply similar relative strengths/weaknesses between the models. However, the significant drop in accuracy for both models in Humanities (vs. STEM/Social Sciences) highlights potential challenges in processing humanities-related data, possibly due to domain-specific linguistic or contextual complexities. The "Other" category’s lower performance for both models warrants further investigation into data quality or model generalizability.