## Heatmaps: BLEU Score and Exact Match vs. Transformation
### Overview
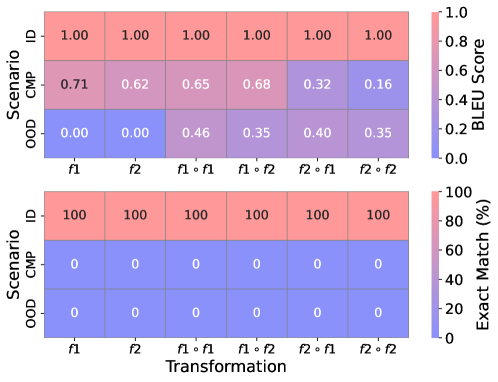
The image presents two heatmaps, one displaying BLEU scores and the other displaying exact match percentages, for different scenarios (ID, CMP, OOD) under various transformations (f1, f2, f1·f1, f1·f2, f2·f1, f2·f2). The heatmaps use a color gradient from blue to red to represent the values, with blue indicating lower values and red indicating higher values.
### Components/Axes
* **Top Heatmap:**
* **Y-axis (Scenario):** ID, CMP, OOD
* **X-axis (Transformation):** f1, f2, f1·f1, f1·f2, f2·f1, f2·f2
* **Color Scale:** Represents BLEU Score, ranging from 0.0 (blue) to 1.0 (red).
* **Title:** BLEU Score (located on the right side of the heatmap)
* **Bottom Heatmap:**
* **Y-axis (Scenario):** ID, CMP, OOD
* **X-axis (Transformation):** f1, f2, f1·f1, f1·f2, f2·f1, f2·f2
* **Color Scale:** Represents Exact Match (%), ranging from 0% (blue) to 100% (red).
* **Title:** Exact Match (%) (located on the right side of the heatmap)
* **Shared X-axis Label:** Transformation (located below the bottom heatmap)
### Detailed Analysis
**Top Heatmap (BLEU Score):**
* **ID Scenario:** The BLEU score is 1.00 for all transformations (f1, f2, f1·f1, f1·f2, f2·f1, f2·f2).
* **CMP Scenario:** The BLEU scores vary across transformations:
* f1: 0.71
* f2: 0.62
* f1·f1: 0.65
* f1·f2: 0.68
* f2·f1: 0.32
* f2·f2: 0.16
* **OOD Scenario:** The BLEU scores are generally lower than CMP:
* f1: 0.00
* f2: 0.00
* f1·f1: 0.46
* f1·f2: 0.35
* f2·f1: 0.40
* f2·f2: 0.35
**Bottom Heatmap (Exact Match %):**
* **ID Scenario:** The exact match percentage is 100% for all transformations (f1, f2, f1·f1, f1·f2, f2·f1, f2·f2).
* **CMP Scenario:** The exact match percentage is 0% for all transformations (f1, f2, f1·f1, f1·f2, f2·f1, f2·f2).
* **OOD Scenario:** The exact match percentage is 0% for all transformations (f1, f2, f1·f1, f1·f2, f2·f1, f2·f2).
### Key Observations
* The ID scenario consistently shows perfect BLEU scores and exact matches across all transformations.
* The CMP scenario has varying BLEU scores depending on the transformation, but always 0% exact match.
* The OOD scenario generally has the lowest BLEU scores and 0% exact match.
* Transformations involving f2 (f2·f1, f2·f2) tend to have lower BLEU scores in the CMP scenario compared to transformations involving f1.
### Interpretation
The heatmaps illustrate the performance of a system under different scenarios and transformations. The ID scenario represents in-distribution data, where the system performs perfectly. The CMP scenario represents a compositional split, where the system's performance varies depending on the specific transformation applied. The OOD scenario represents out-of-distribution data, where the system struggles significantly.
The BLEU score measures the similarity between the generated output and the reference output, while the exact match percentage measures the proportion of generated outputs that are identical to the reference outputs. The fact that the ID scenario has both high BLEU scores and high exact match percentages indicates that the system is able to generate accurate and precise outputs for in-distribution data. The lower BLEU scores and zero exact match percentages for the CMP and OOD scenarios suggest that the system is not able to generalize well to unseen data or compositional variations.
The difference in BLEU scores between different transformations in the CMP scenario suggests that some transformations are more challenging for the system than others. For example, transformations involving f2 may introduce more noise or ambiguity, leading to lower BLEU scores. The zero exact match percentages for CMP and OOD scenarios indicate that the system rarely produces the exact expected output, even when the BLEU score is non-zero, suggesting that while the generated output may be semantically similar, it is not identical to the reference.