\n
## Line Chart: Accuracy vs. Thinking Compute
### Overview
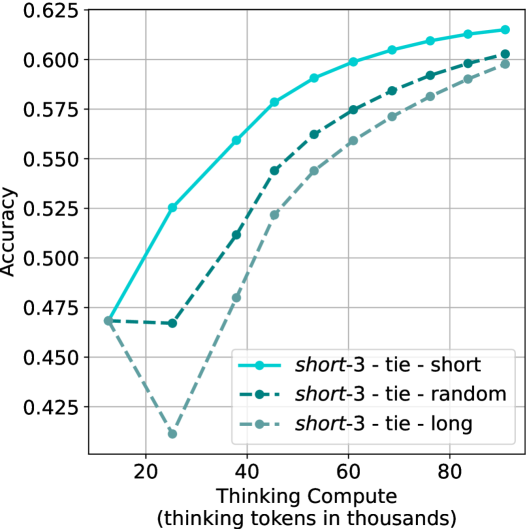
The image presents a line chart illustrating the relationship between "Thinking Compute" (measured in thousands of thinking tokens) and "Accuracy" for three different configurations: "short-3 - tie - short", "short-3 - tie - random", and "short-3 - tie - long". The chart displays how accuracy changes as the amount of thinking compute increases.
### Components/Axes
* **X-axis:** "Thinking Compute (thinking tokens in thousands)". The scale ranges from approximately 0 to 90, with markers at 20, 40, 60, and 80.
* **Y-axis:** "Accuracy". The scale ranges from approximately 0.42 to 0.625, with markers at 0.425, 0.475, 0.525, 0.575, and 0.625.
* **Legend:** Located in the bottom-right corner.
* "short-3 - tie - short" (Solid Blue Line with Circle Markers)
* "short-3 - tie - random" (Dashed Black Line with Circle Markers)
* "short-3 - tie - long" (Dashed Grey Line with Circle Markers)
* **Gridlines:** A light grey grid is present to aid in reading values.
### Detailed Analysis
* **short-3 - tie - short (Solid Blue Line):** This line shows a strong upward trend, starting at approximately 0.465 at a Thinking Compute of 20. It increases steadily, reaching approximately 0.605 at a Thinking Compute of 60, and plateaus around 0.61 at a Thinking Compute of 80.
* (20, 0.465)
* (40, 0.56)
* (60, 0.605)
* (80, 0.61)
* **short-3 - tie - random (Dashed Black Line):** This line also exhibits an upward trend, but it is less pronounced than the "short-3 - tie - short" line. It begins at approximately 0.475 at a Thinking Compute of 20, rises to approximately 0.57 at a Thinking Compute of 60, and reaches approximately 0.595 at a Thinking Compute of 80.
* (20, 0.475)
* (40, 0.52)
* (60, 0.57)
* (80, 0.595)
* **short-3 - tie - long (Dashed Grey Line):** This line shows the slowest increase in accuracy. It starts at approximately 0.425 at a Thinking Compute of 20, dips slightly to approximately 0.42 at a Thinking Compute of 40, then rises to approximately 0.56 at a Thinking Compute of 60, and reaches approximately 0.59 at a Thinking Compute of 80.
* (20, 0.425)
* (40, 0.42)
* (60, 0.56)
* (80, 0.59)
### Key Observations
* The "short-3 - tie - short" configuration consistently achieves the highest accuracy across all levels of Thinking Compute.
* The "short-3 - tie - long" configuration initially performs the worst, but its accuracy increases with higher Thinking Compute, though it remains below the other two configurations.
* All three configurations demonstrate diminishing returns in accuracy as Thinking Compute increases beyond 60. The rate of accuracy improvement slows down significantly.
* The "short-3 - tie - long" configuration shows a slight dip in accuracy between 20 and 40 Thinking Compute.
### Interpretation
The data suggests that increasing the amount of "Thinking Compute" generally improves accuracy, but the benefit diminishes as the compute increases. The configuration "short-3 - tie - short" is the most effective in terms of achieving high accuracy with a given amount of compute. The initial dip in accuracy for the "short-3 - tie - long" configuration could indicate a period of adjustment or instability before the benefits of increased compute begin to manifest. The differences in performance between the configurations likely relate to the specific strategies or parameters used in each, and the data highlights the importance of optimizing these factors to maximize accuracy. The plateauing of accuracy suggests that there are other limiting factors beyond simply increasing compute, such as the quality of the underlying model or the complexity of the task.