\n
## Line Chart: Accuracy vs. Thinking Compute for Different Tie-Breaking Strategies
### Overview
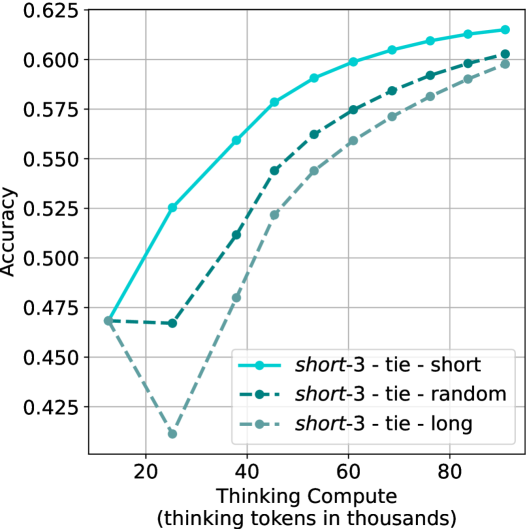
The image is a line chart plotting model accuracy against computational effort ("Thinking Compute") for three different experimental conditions or strategies. The chart demonstrates how accuracy scales with increased compute for each strategy, showing distinct performance trajectories.
### Components/Axes
* **X-Axis (Horizontal):**
* **Label:** `Thinking Compute (thinking tokens in thousands)`
* **Scale:** Linear scale from approximately 10 to 90 (thousands of tokens).
* **Major Tick Markers:** 20, 40, 60, 80.
* **Y-Axis (Vertical):**
* **Label:** `Accuracy`
* **Scale:** Linear scale from 0.425 to 0.625.
* **Major Tick Markers:** 0.425, 0.450, 0.475, 0.500, 0.525, 0.550, 0.575, 0.600, 0.625.
* **Legend:**
* **Position:** Bottom-right corner of the chart area.
* **Entries (from top to bottom):**
1. **Solid cyan line with circle markers:** `short-3 - tie - short`
2. **Dashed dark teal line with circle markers:** `short-3 - tie - random`
3. **Dotted gray line with circle markers:** `short-3 - tie - long`
### Detailed Analysis
**1. Data Series: `short-3 - tie - short` (Solid Cyan Line)**
* **Trend:** This line shows a strong, consistent upward trend that begins to plateau at higher compute levels. It is the top-performing strategy across the entire range.
* **Data Points (Approximate):**
* At ~10k tokens: Accuracy ≈ 0.470
* At ~25k tokens: Accuracy ≈ 0.525
* At ~40k tokens: Accuracy ≈ 0.560
* At ~55k tokens: Accuracy ≈ 0.590
* At ~70k tokens: Accuracy ≈ 0.605
* At ~85k tokens: Accuracy ≈ 0.615
* At ~90k tokens: Accuracy ≈ 0.618
**2. Data Series: `short-3 - tie - random` (Dashed Dark Teal Line)**
* **Trend:** This line shows an initial dip, followed by a steady upward trend. It consistently performs below the `short` strategy but above the `long` strategy for most of the range.
* **Data Points (Approximate):**
* At ~10k tokens: Accuracy ≈ 0.470 (similar starting point to `short`)
* At ~25k tokens: Accuracy ≈ 0.465 (slight dip)
* At ~40k tokens: Accuracy ≈ 0.510
* At ~55k tokens: Accuracy ≈ 0.545
* At ~70k tokens: Accuracy ≈ 0.575
* At ~85k tokens: Accuracy ≈ 0.595
* At ~90k tokens: Accuracy ≈ 0.602
**3. Data Series: `short-3 - tie - long` (Dotted Gray Line)**
* **Trend:** This line exhibits a significant initial drop, followed by a strong recovery and upward trend. It is the lowest-performing strategy until very high compute levels, where it nearly converges with the `random` strategy.
* **Data Points (Approximate):**
* At ~10k tokens: Accuracy ≈ 0.470
* At ~25k tokens: Accuracy ≈ 0.410 (sharp dip, the lowest point on the chart)
* At ~40k tokens: Accuracy ≈ 0.480
* At ~55k tokens: Accuracy ≈ 0.520
* At ~70k tokens: Accuracy ≈ 0.560
* At ~85k tokens: Accuracy ≈ 0.590
* At ~90k tokens: Accuracy ≈ 0.598
### Key Observations
1. **Performance Hierarchy:** The `short-3 - tie - short` strategy is unambiguously superior, achieving the highest accuracy at every measured point beyond the initial value.
2. **The 25k Token Dip:** Both the `random` and `long` strategies show a performance decrease or stagnation at approximately 25,000 thinking tokens, with the `long` strategy experiencing a dramatic drop. The `short` strategy does not exhibit this dip.
3. **Convergence at High Compute:** As thinking compute increases towards 90k tokens, the performance gap between the `random` and `long` strategies narrows significantly, though both remain below the `short` strategy.
4. **Diminishing Returns:** All three curves show signs of diminishing returns; the slope (rate of accuracy improvement per additional token) decreases as compute increases, particularly for the top-performing `short` strategy after ~60k tokens.
### Interpretation
This chart likely comes from research on large language model (LLM) reasoning or "chain-of-thought" processing, where "thinking tokens" represent internal computation before generating a final answer. The labels suggest an experiment on how to break ties or handle ambiguity (`tie`) in a model's internal reasoning process (`short-3` likely refers to a specific model or prompt configuration).
The data suggests a clear conclusion: **employing a "short" tie-breaking strategy is more effective and compute-efficient than "random" or "long" strategies.** The "long" strategy's severe performance penalty at low-to-mid compute (25k tokens) indicates it may introduce noise or confusion that requires substantially more computational resources to overcome. The eventual convergence of `random` and `long` at high compute implies that with enough processing power, the negative effects of a poor tie-breaking heuristic can be mitigated, but never fully erased, as the `short` strategy maintains its lead. For practical applications, this indicates that careful design of internal reasoning heuristics (like tie-breaking) is crucial for achieving high accuracy without requiring excessive computational resources.