## Line Chart: Accuracy vs. Thinking Compute (Tokens in Thousands)
### Overview
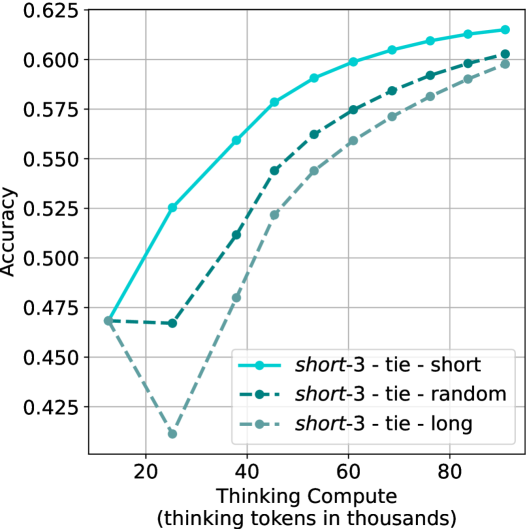
The chart illustrates the relationship between computational resources (measured in "thinking tokens in thousands") and accuracy across three experimental configurations: "short-3 tie-short," "short-3 tie-random," and "short-3 tie-long." Accuracy is plotted on the y-axis (0.425–0.625), while the x-axis represents computational load (20–80k tokens). Three distinct lines depict performance trends, with notable divergences in accuracy trajectories.
### Components/Axes
- **X-axis**: "Thinking Compute (thinking tokens in thousands)"
- Scale: 20, 40, 60, 80 (in thousands of tokens).
- **Y-axis**: "Accuracy"
- Scale: 0.425, 0.450, 0.475, 0.500, 0.525, 0.550, 0.575, 0.600, 0.625.
- **Legend**: Located at the bottom-right corner.
- **short-3 tie-short**: Blue solid line.
- **short-3 tie-random**: Black dashed line.
- **short-3 tie-long**: Gray dotted line.
### Detailed Analysis
1. **short-3 tie-short (Blue Solid Line)**
- **Trend**: Starts at ~0.475 accuracy at 20k tokens, rises steadily to ~0.625 at 80k tokens.
- **Key Points**:
- 20k tokens: 0.475
- 40k tokens: ~0.550
- 60k tokens: ~0.595
- 80k tokens: ~0.620
2. **short-3 tie-random (Black Dashed Line)**
- **Trend**: Begins at ~0.475, dips sharply to ~0.425 at 40k tokens, then recovers to ~0.605 at 80k tokens.
- **Key Points**:
- 20k tokens: 0.475
- 40k tokens: 0.425
- 60k tokens: ~0.575
- 80k tokens: ~0.605
3. **short-3 tie-long (Gray Dotted Line)**
- **Trend**: Starts at ~0.475, plunges to ~0.425 at 40k tokens, then climbs to ~0.595 at 80k tokens.
- **Key Points**:
- 20k tokens: 0.475
- 40k tokens: 0.425
- 60k tokens: ~0.550
- 80k tokens: ~0.595
### Key Observations
- All configurations begin at the same accuracy (0.475) at 20k tokens.
- **short-3 tie-short** consistently outperforms the other two configurations across all token thresholds.
- **short-3 tie-random** and **short-3 tie-long** exhibit identical dips at 40k tokens but recover differently:
- **tie-random** achieves higher accuracy at 80k tokens (~0.605 vs. ~0.595 for tie-long).
- The sharp dip at 40k tokens for tie-random and tie-long suggests a critical threshold where computational load negatively impacts accuracy before recovery.
### Interpretation
The data suggests that computational resource allocation significantly impacts accuracy, with the "short-3 tie-short" configuration demonstrating optimal performance. The dips at 40k tokens for tie-random and tie-long may indicate inefficiencies or instability in resource utilization at this threshold. Recovery patterns imply that longer compute times (tie-long) may require more tokens to regain performance parity with tie-short. The consistent superiority of tie-short highlights potential architectural or algorithmic advantages in this configuration.
**Note**: All values are approximate, derived from visual interpolation of the chart’s grid and line trajectories.