## Scatter Plot: A3c Utterance-Level Prediction (Fold 0, N=385)
### Overview
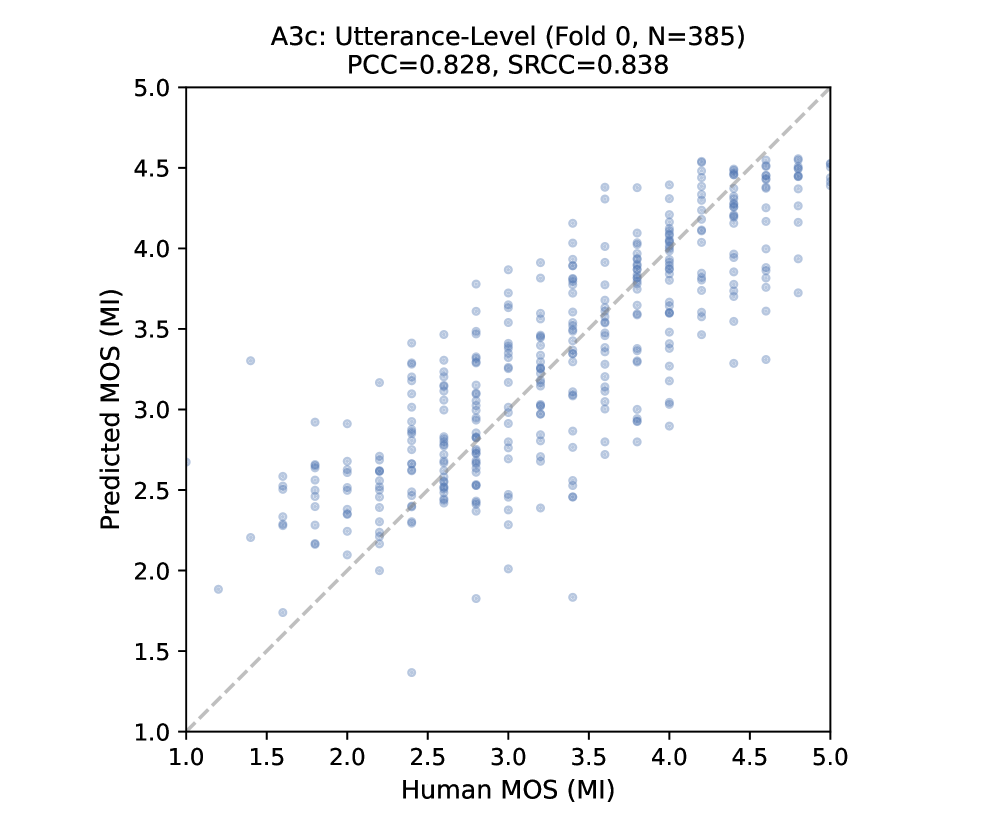
The image is a scatter plot comparing human-assessed Mean Opinion Scores (MOS) against model-predicted MOS values for utterance-level analysis. The plot includes a dashed line representing the line of perfect prediction (y=x), with statistical metrics (PCC=0.828, SRCC=0.838) indicating strong correlation between human and model assessments.
### Components/Axes
- **X-axis**: Human MOS (MI)
- Scale: 1.0 to 5.0 (linear)
- Label: "Human MOS (MI)"
- **Y-axis**: Predicted MOS (MI)
- Scale: 1.0 to 5.0 (linear)
- Label: "Predicted MOS (MI)"
- **Dashed Line**: Gray line of perfect prediction (y=x)
- **Data Points**: Blue circles (N=385)
- **Title**: "A3c: Utterance-Level (Fold 0, N=385)"
- **Statistical Metrics**:
- PCC (Pearson Correlation Coefficient): 0.828
- SRCC (Spearman Rank Correlation Coefficient): 0.838
### Detailed Analysis
- **Data Distribution**:
- Points cluster tightly around the dashed line, with minor vertical/horizontal spread.
- Higher density of points in the 2.5–4.5 MOS range for both axes.
- No extreme outliers (all points within 1.0–5.0 bounds).
- **Correlation Metrics**:
- PCC=0.828 (strong linear relationship)
- SRCC=0.838 (strong monotonic relationship)
- **Fold Context**: "Fold 0" suggests this is one iteration of cross-validation (likely part of a larger k-fold analysis).
### Key Observations
1. **High Agreement**: The near-diagonal clustering of points indicates the model predictions closely match human judgments.
2. **Consistent Correlation**: Both PCC and SRCC values exceed 0.8, suggesting robust performance across linear and rank-based relationships.
3. **Uniform Coverage**: Data points span the full MOS range (1.0–5.0), though mid-range scores dominate.
### Interpretation
The plot demonstrates that the A3c model achieves high fidelity in predicting human-rated utterance quality. The strong PCC/SRCC values confirm the model captures both magnitude and ordinal relationships in MOS data. The "Fold 0" designation implies this is one validation iteration, and similar results across other folds would strengthen confidence in generalizability. The MI unit (likely Mel scale) contextualizes the scores as perceptual ratings, emphasizing the model's utility in speech/utterance evaluation tasks. The absence of extreme outliers suggests the model handles edge cases (e.g., very low/high scores) reasonably well.