## Line Chart: Attention Key Query Score, a=8
### Overview
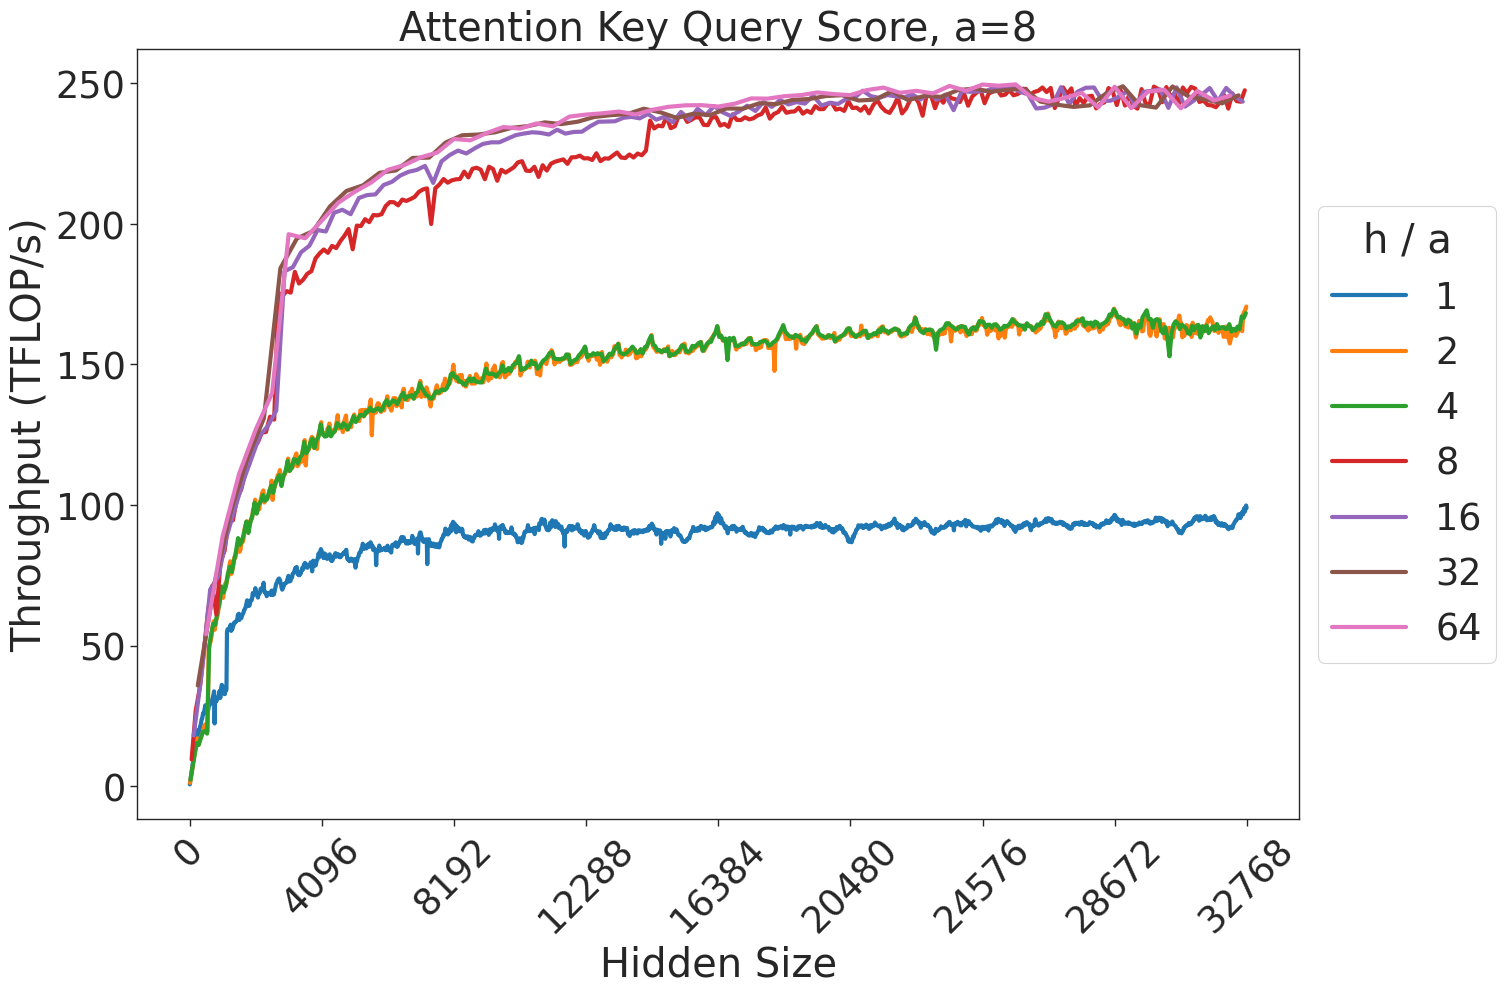
This chart illustrates the relationship between "Hidden Size" (x-axis) and "Throughput (TFLOP/s)" (y-axis) for an attention mechanism, parameterized by different "h / a" ratios. The data shows a clear logarithmic-style growth curve for all configurations, where throughput increases rapidly at lower hidden sizes before plateauing as the hidden size increases.
### Components/Axes
* **Title:** "Attention Key Query Score, a=8" (Centered at the top).
* **Y-Axis:** "Throughput (TFLOP/s)". The scale ranges from 0 to 250, with major tick marks every 50 units.
* **X-Axis:** "Hidden Size". The scale ranges from 0 to 32768, with major tick marks every 4096 units.
* **Legend:** Located on the right side of the chart. It defines the "h / a" ratio, with corresponding line colors:
* **Blue:** 1
* **Orange:** 2
* **Green:** 4
* **Red:** 8
* **Purple:** 16
* **Brown:** 32
* **Pink:** 64
### Detailed Analysis
The data series cluster into three distinct performance tiers based on the "h / a" ratio. All lines exhibit a steep upward slope from 0 to approximately 4096 hidden size, followed by a gradual plateau.
**1. Tier 1 (Lowest Performance):**
* **Series:** h/a = 1 (Blue).
* **Trend:** Starts at 0, rises steeply to ~60 TFLOP/s at a hidden size of ~2000. It continues to climb at a slower rate, plateauing between 90 and 100 TFLOP/s for the remainder of the x-axis.
**2. Tier 2 (Intermediate Performance):**
* **Series:** h/a = 2 (Orange) and h/a = 4 (Green).
* **Trend:** These two lines are nearly identical and overlap significantly. They rise steeply to ~120 TFLOP/s at a hidden size of ~2000. They continue to climb, plateauing between 160 and 170 TFLOP/s.
**3. Tier 3 (Highest Performance):**
* **Series:** h/a = 8 (Red), 16 (Purple), 32 (Brown), 64 (Pink).
* **Trend:** These lines form the top cluster. They rise very steeply to ~180-200 TFLOP/s at a hidden size of ~2000.
* **Observation:** The Red line (h/a=8) shows slightly lower performance than the others in the 4096 to 12288 range, but eventually converges with the Purple, Brown, and Pink lines. The entire group plateaus between 240 and 250 TFLOP/s.
### Key Observations
* **Diminishing Returns:** Regardless of the "h/a" ratio, there is a clear "knee" in the curve around a hidden size of 4096. Increasing the hidden size beyond this point yields minimal throughput gains.
* **Clustering:** The performance is not linearly dependent on the "h/a" ratio. Instead, it groups into three distinct performance bands, suggesting that the hardware architecture has specific "sweet spots" for parallelization efficiency.
* **Noise:** There is high-frequency jitter (noise) present in all lines, particularly in the plateau regions, which is common in hardware performance benchmarking.
### Interpretation
The data demonstrates that the "h/a" ratio is a critical factor in maximizing computational throughput for this specific attention mechanism.
* **Efficiency Gains:** Increasing the "h/a" ratio from 1 to 8 provides a massive performance boost (roughly 2.5x increase in peak throughput). However, increasing the ratio beyond 8 (to 16, 32, or 64) provides negligible additional throughput, suggesting that the hardware reaches a saturation point in its ability to utilize parallel attention heads.
* **Bottleneck Analysis:** The rapid plateauing after a hidden size of 4096 suggests that the system is likely memory-bandwidth bound or compute-bound once the hidden size is large enough to saturate the available execution units.
* **Peircean Investigative Note:** The fact that the Red line (h/a=8) lags slightly behind the higher ratios (16, 32, 64) before converging suggests that while 8 is sufficient to reach peak performance, higher ratios might reach that peak slightly more efficiently or with less variance in specific intermediate hidden size ranges.