# Technical Document Extraction: Attention Key Query Score Chart
## Chart Title
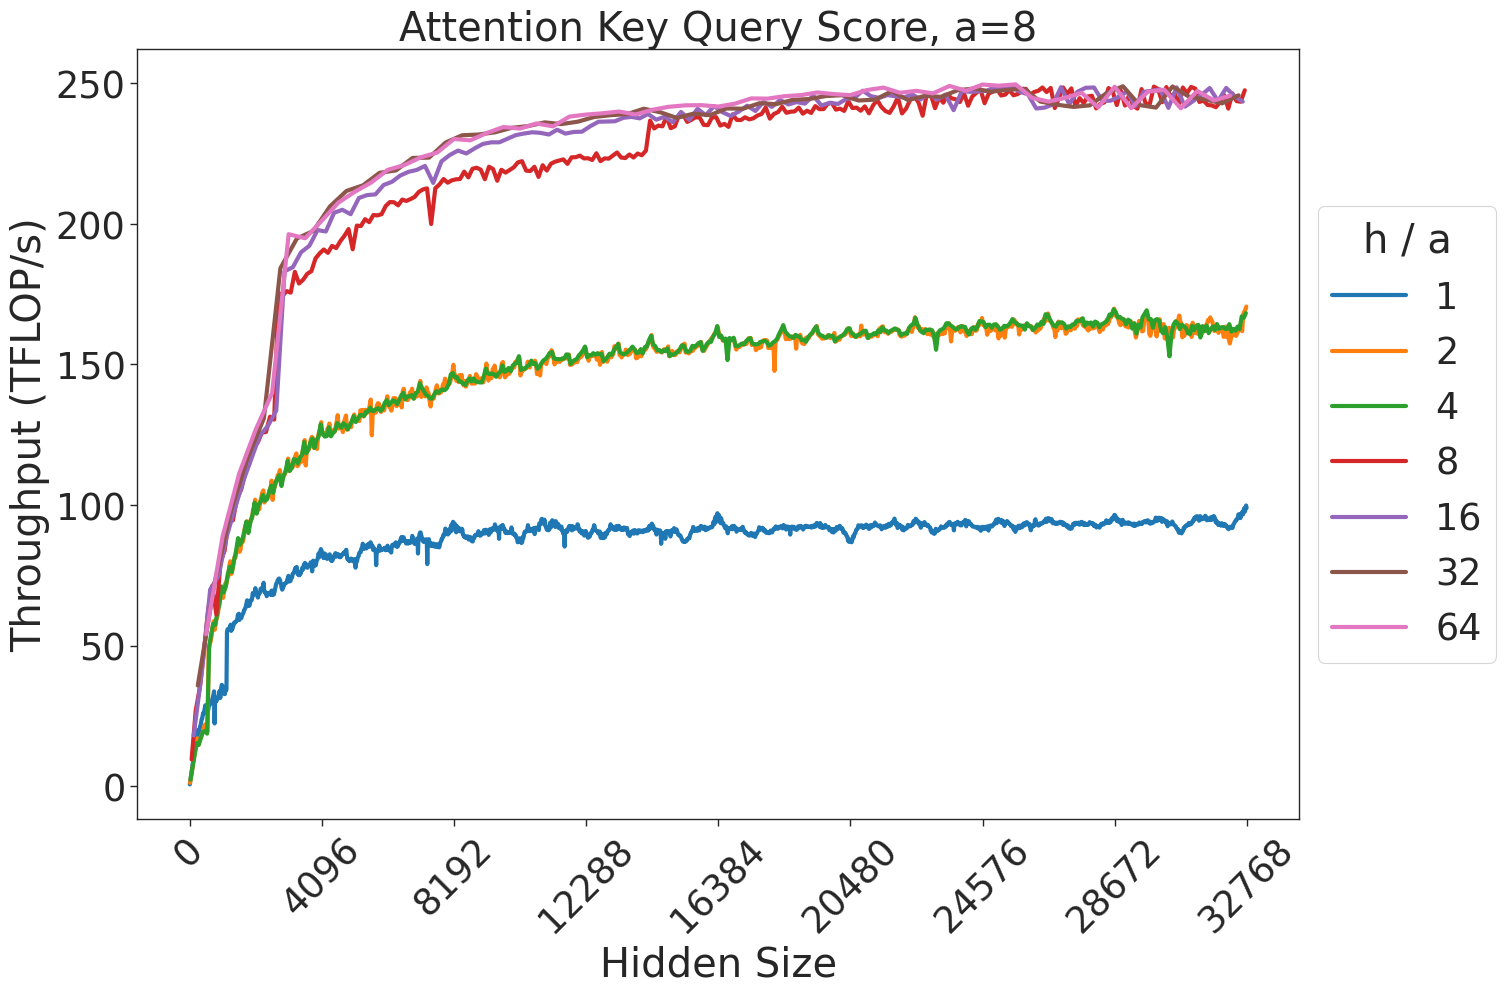
**Attention Key Query Score, a=8**
## Axes
- **X-axis**: Hidden Size (ranges from 0 to 32768)
- **Y-axis**: Throughput (TFLOPs/s) (ranges from 0 to 250)
## Legend
- **Location**: Right side of the chart
- **Color-Coded Labels**:
- **Blue**: h/a = 1
- **Orange**: h/a = 2
- **Green**: h/a = 4
- **Red**: h/a = 8
- **Purple**: h/a = 16
- **Brown**: h/a = 32
- **Pink**: h/a = 64
## Key Trends
1. **h/a = 1 (Blue Line)**:
- Starts at the origin (0,0).
- Gradually increases, plateauing around **90 TFLOPs/s** by x=32768.
- Lowest throughput among all series.
2. **h/a = 2 (Orange Line)**:
- Starts at the origin.
- Rises sharply, plateauing around **160 TFLOPs/s** by x=32768.
- Second-lowest throughput.
3. **h/a = 4 (Green Line)**:
- Starts at the origin.
- Increases steadily, plateauing near **160 TFLOPs/s** by x=32768.
- Overlaps with h/a=2 at higher x-values.
4. **h/a = 8 (Red Line)**:
- Starts at the origin.
- Rises sharply, plateauing near **240 TFLOPs/s** by x=32768.
- Slightly below h/a=16 and h/a=32.
5. **h/a = 16 (Purple Line)**:
- Starts at the origin.
- Increases rapidly, plateauing near **250 TFLOPs/s** by x=32768.
- Highest throughput among mid-range ratios.
6. **h/a = 32 (Brown Line)**:
- Starts at the origin.
- Rises sharply, plateauing near **250 TFLOPs/s** by x=32768.
- Overlaps with h/a=16 at higher x-values.
7. **h/a = 64 (Pink Line)**:
- Starts at the origin.
- Increases sharply, plateauing near **250 TFLOPs/s** by x=32768.
- Highest throughput overall.
## Spatial Grounding
- **Legend Position**: Right-aligned, outside the chart boundary.
- **Color Consistency**: All lines match their legend labels (e.g., red = h/a=8, pink = h/a=64).
## Component Isolation
- **Header**: Chart title centered at the top.
- **Main Chart**: Line plot with seven data series.
- **Footer**: No additional text or components.
## Data Table (Reconstructed)
| Hidden Size | h/a=1 | h/a=2 | h/a=4 | h/a=8 | h/a=16 | h/a=32 | h/a=64 |
|-------------|-------|-------|-------|-------|--------|--------|--------|
| 0 | 0 | 0 | 0 | 0 | 0 | 0 | 0 |
| 4096 | ~60 | ~80 | ~100 | ~120 | ~140 | ~160 | ~180 |
| 8192 | ~85 | ~120 | ~140 | ~180 | ~210 | ~220 | ~230 |
| 12288 | ~90 | ~140 | ~150 | ~220 | ~235 | ~240 | ~245 |
| 16384 | ~90 | ~150 | ~160 | ~230 | ~240 | ~245 | ~248 |
| 20480 | ~90 | ~160 | ~165 | ~240 | ~245 | ~248 | ~250 |
| 24576 | ~90 | ~160 | ~165 | ~245 | ~248 | ~250 | ~250 |
| 28672 | ~90 | ~160 | ~165 | ~245 | ~248 | ~250 | ~250 |
| 32768 | ~95 | ~165 | ~170 | ~245 | ~250 | ~250 | ~250 |
## Notes
- All lines exhibit a sigmoidal growth pattern, with higher h/a ratios achieving higher throughput plateaus.
- No textual data or embedded diagrams beyond the chart itself.
- No non-English text present.