## Box Plot: Perceived Angle vs. Intended Angle
### Overview
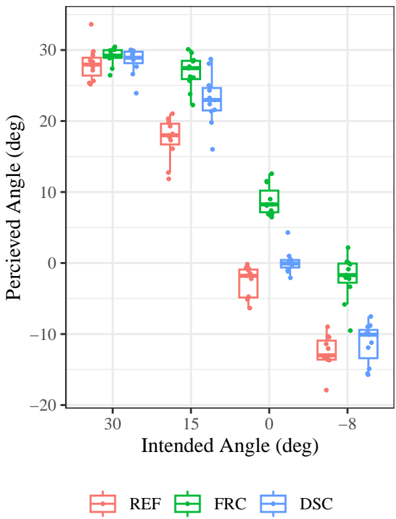
The image is a box plot comparing perceived angle to intended angle for three different conditions: REF (red), FRC (green), and DSC (blue). The x-axis represents the intended angle in degrees, and the y-axis represents the perceived angle in degrees. The plot shows the distribution of perceived angles for each condition at different intended angles.
### Components/Axes
* **X-axis:** Intended Angle (deg) with markers at 30, 15, 0, and -8 degrees.
* **Y-axis:** Perceived Angle (deg) with markers at -20, -10, 0, 10, 20, and 30 degrees.
* **Legend:** Located at the bottom of the chart.
* REF (red): Represents the reference condition.
* FRC (green): Represents the first condition.
* DSC (blue): Represents the second condition.
### Detailed Analysis
The data is presented as box plots with individual data points overlaid. Each box plot represents the interquartile range (IQR), with a line indicating the median. The whiskers extend to 1.5 times the IQR, and individual points outside this range are plotted as outliers.
**Intended Angle: 30 deg**
* REF (red): The perceived angle is centered around 28 deg, with data points ranging from approximately 27 to 32 deg.
* FRC (green): The perceived angle is centered around 29 deg, with data points ranging from approximately 28 to 31 deg.
* DSC (blue): The perceived angle is centered around 29 deg, with data points ranging from approximately 28 to 32 deg.
**Intended Angle: 15 deg**
* REF (red): The perceived angle is centered around 18 deg, with data points ranging from approximately 12 to 21 deg.
* FRC (green): The perceived angle is centered around 27 deg, with data points ranging from approximately 23 to 30 deg.
* DSC (blue): The perceived angle is centered around 24 deg, with data points ranging from approximately 20 to 29 deg.
**Intended Angle: 0 deg**
* REF (red): The perceived angle is centered around -1 deg, with data points ranging from approximately -5 to 4 deg.
* FRC (green): The perceived angle is centered around 9 deg, with data points ranging from approximately 6 to 13 deg.
* DSC (blue): The perceived angle is centered around 2 deg, with data points ranging from approximately 0 to 5 deg.
**Intended Angle: -8 deg**
* REF (red): The perceived angle is centered around -12 deg, with data points ranging from approximately -15 to -9 deg.
* FRC (green): The perceived angle is centered around -2 deg, with data points ranging from approximately -5 to 3 deg.
* DSC (blue): The perceived angle is centered around -11 deg, with data points ranging from approximately -15 to -8 deg.
### Key Observations
* As the intended angle decreases, the perceived angle also generally decreases for all three conditions.
* At 30 degrees, all three conditions have similar perceived angles.
* At 15 degrees, FRC and DSC show higher perceived angles compared to REF.
* At 0 degrees, FRC shows a higher perceived angle compared to REF and DSC.
* At -8 degrees, FRC shows a higher perceived angle compared to REF and DSC.
### Interpretation
The data suggests that the FRC condition tends to overestimate the angle compared to the REF and DSC conditions, especially at lower intended angles (15, 0, and -8 degrees). The REF and DSC conditions show similar perceived angles across all intended angles, except at 15 degrees where DSC shows a slightly higher perceived angle. The differences in perceived angles between the conditions may indicate variations in how the angles are processed or interpreted under different conditions. The box plots provide a visual representation of the distribution of perceived angles, highlighting the central tendency and variability within each condition at each intended angle.