## Diagram: Sequential Process of Event-Driven System Modeling
### Overview
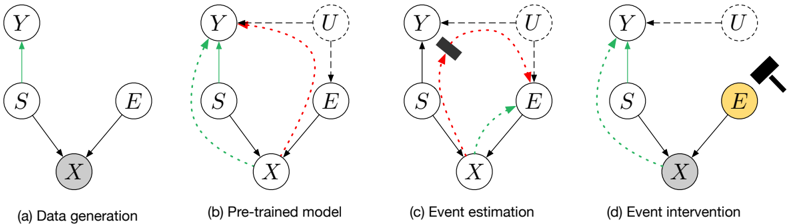
The image presents a four-stage progression of a system modeling workflow, visualized through interconnected node diagrams. Each stage builds upon the previous one, introducing new components and relationships. The diagrams use standardized node shapes (circles) and directional arrows to represent data flow and system interactions.
### Components/Axes
**Nodes:**
- **X**: Central node in all diagrams (gray in a/d, white in b/c)
- **Y**: Output node (top position)
- **S**: Intermediate node (left position)
- **E**: Event node (right position)
- **U**: External factor (top-right position, dashed connections)
**Arrows:**
- **Solid green**: Primary data flow (a/d)
- **Dashed red**: Pre-trained model influence (b/c)
- **Dotted green**: Secondary data flow (b)
- **Black rectangle**: Model component (b)
- **Hammer icon**: Intervention tool (c/d)
**Color Coding:**
- **Gray**: Input/baseline state (X in a/d)
- **Yellow**: Active intervention state (E in d)
- **Black**: Model component (b)
- **Red**: Error/estimation path (c)
### Detailed Analysis
**Diagram (a) - Data Generation**
- X → S → Y (solid green)
- X → E → Y (solid green)
- No external factors (U absent)
**Diagram (b) - Pre-trained Model**
- Adds U node with dashed connections to Y and E
- Introduces black rectangle (model component) between S and E
- Maintains original green flows but adds red dashed feedback loop from Y to S
**Diagram (c) - Event Estimation**
- Adds hammer icon (intervention tool) near E
- Red dashed arrow from Y to S indicates error correction
- U connection to E becomes solid red
**Diagram (d) - Event Intervention**
- E node highlighted yellow (active state)
- Hammer icon now directly connected to E
- Green flow from S to E becomes solid
- U connection to Y becomes dashed
### Key Observations
1. **Progression Complexity**: Each stage adds complexity through new nodes/components
2. **Feedback Loops**: Red dashed arrows indicate iterative refinement processes
3. **State Changes**: Color transitions (gray→yellow) show node activation states
4. **Tool Integration**: Hammer icon evolves from passive (c) to active (d) role
### Interpretation
This sequence illustrates an event-driven system workflow where:
1. **Data Generation** establishes baseline relationships between input (X), intermediate (S), and output (Y) nodes
2. **Pre-trained Model** introduces external factors (U) and model components, creating feedback loops for refinement
3. **Event Estimation** adds intervention capabilities (hammer) and error correction mechanisms
4. **Event Intervention** demonstrates active state management through color changes and direct tool integration
The diagrams suggest a cyclical improvement process where system outputs (Y) continuously inform model adjustments through error feedback, while external factors (U) maintain dynamic connections across stages. The yellow-highlighted E node in the final stage emphasizes the critical role of event nodes in the intervention phase.