## Violin Plot: CausalCite Distribution for ToT vs. Non-ToT Papers
### Overview
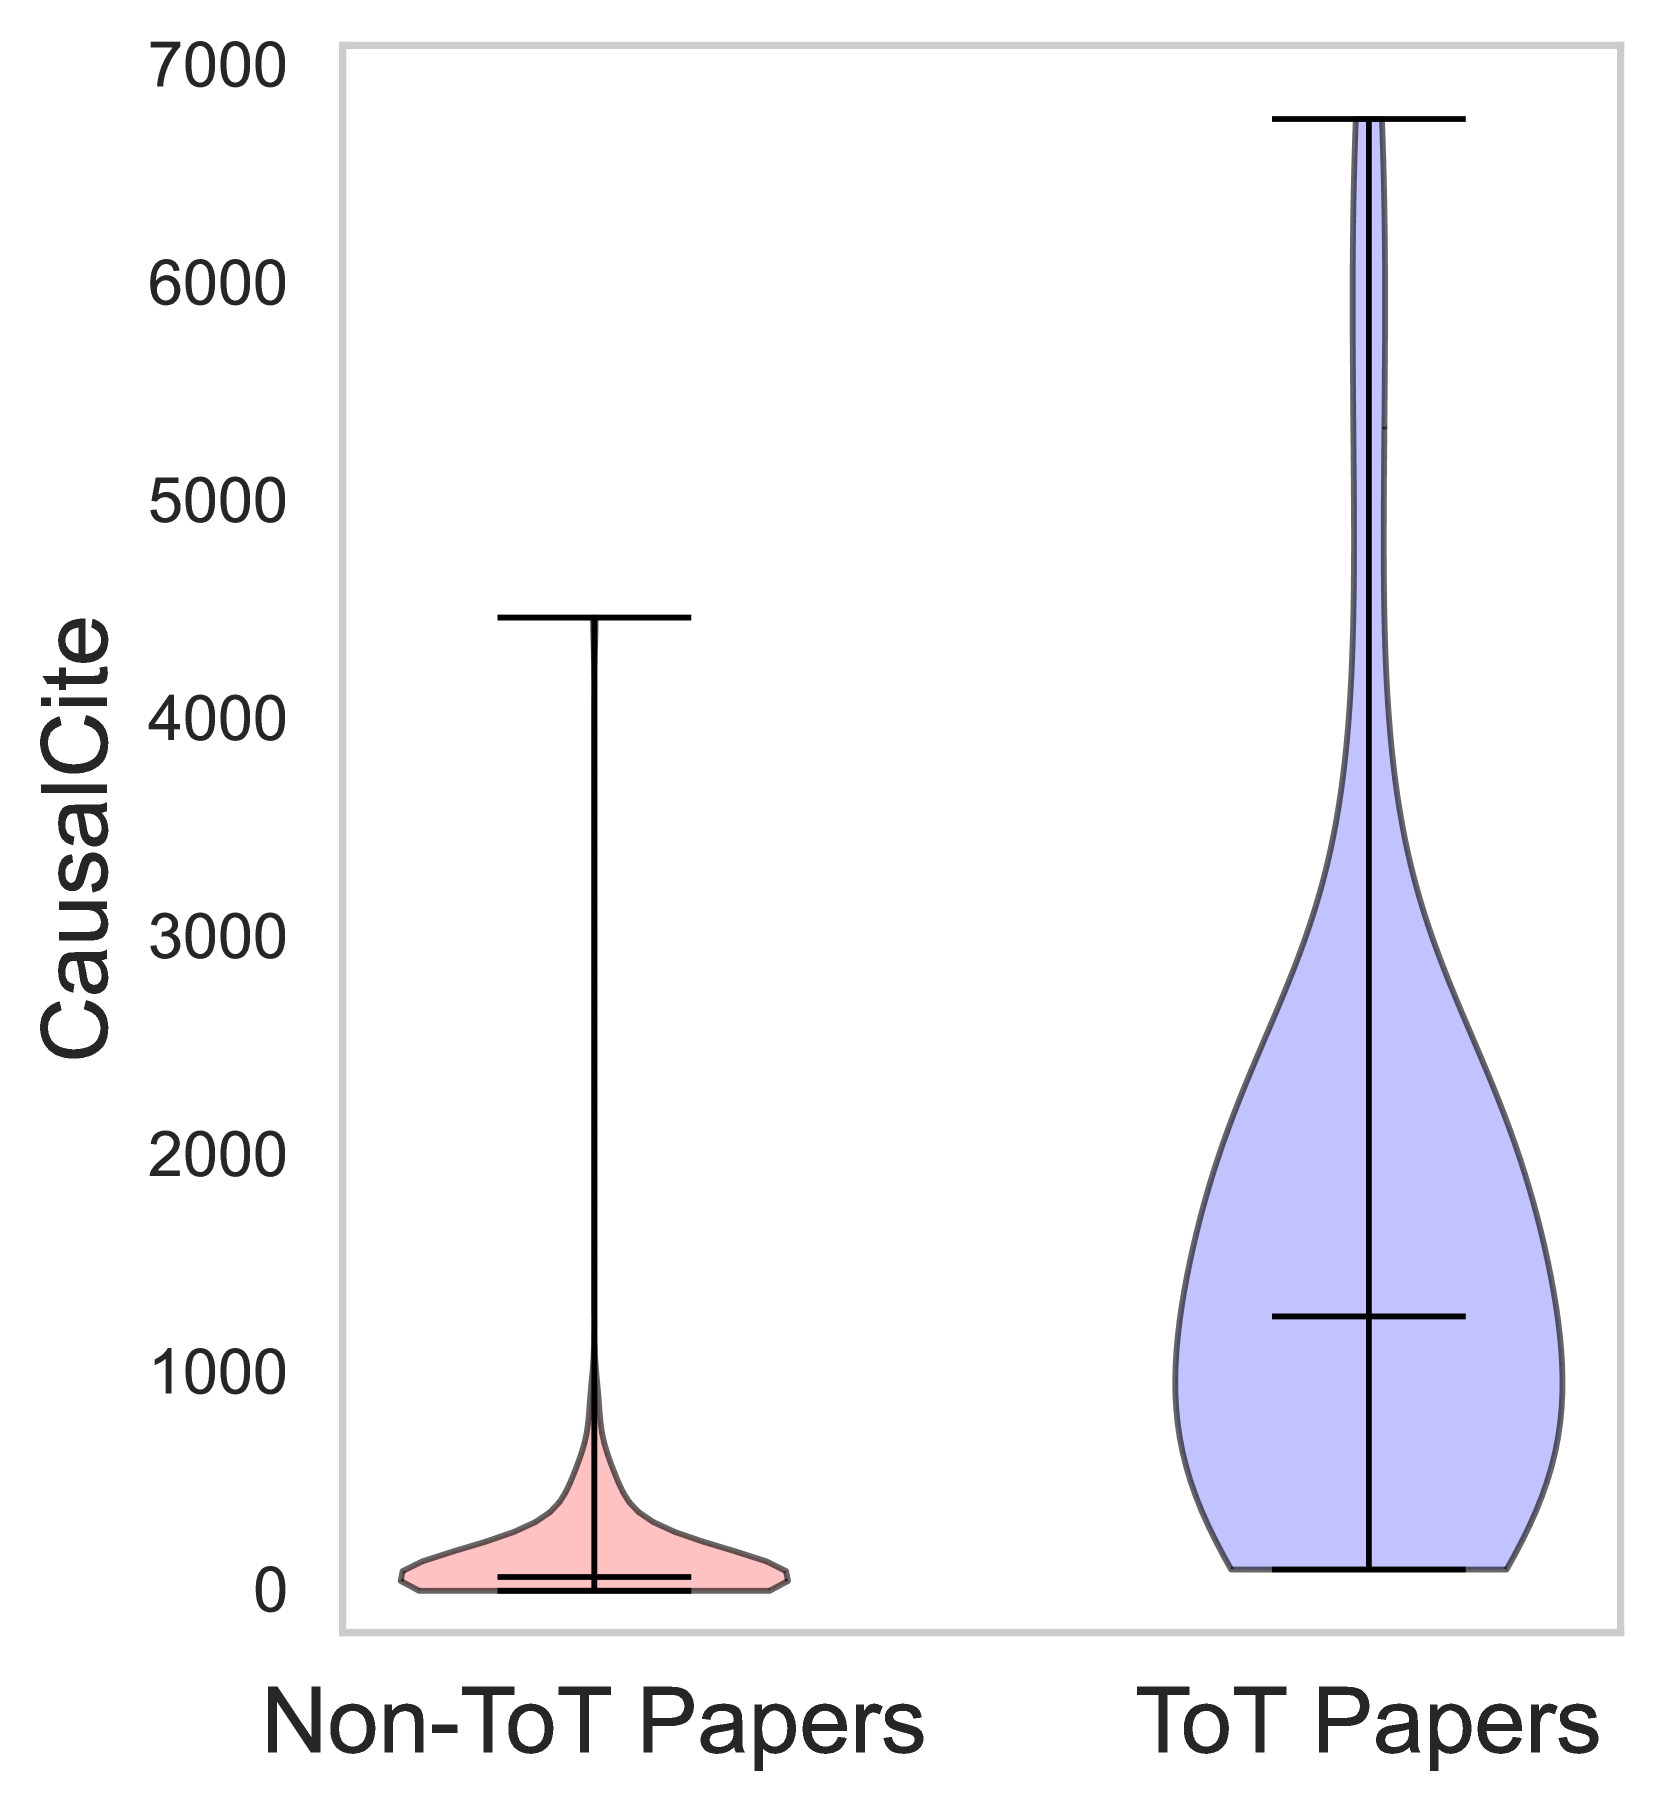
This image is a violin plot comparing the distribution of "CausalCite" (likely citation counts) between two distinct groups of academic papers: "Non-ToT Papers" and "ToT Papers." The plot illustrates that papers categorized as "ToT" (Tree of Thoughts) exhibit a significantly higher citation distribution and a wider range of citation counts compared to the "Non-ToT" control group.
### Components/Axes
* **Y-Axis:** Labeled "CausalCite." The scale is numerical, ranging from 0 to 7000, with major tick marks at intervals of 1000.
* **X-Axis:** Categorical, displaying two groups:
* **Non-ToT Papers:** Positioned on the left.
* **ToT Papers:** Positioned on the right.
* **Visual Elements:**
* **Violin Shapes:** Represent the probability density of the data.
* **Non-ToT Papers:** Filled with a light pink color.
* **ToT Papers:** Filled with a light blue/purple color.
* **Vertical Lines:** Represent the range of the data (whiskers).
* **Horizontal Lines:** Represent the central tendency (median) of the data within each group.
### Detailed Analysis
* **Non-ToT Papers (Left, Pink):**
* **Trend:** The distribution is heavily skewed toward the bottom. The vast majority of the density is concentrated near the 0 mark on the Y-axis.
* **Range:** The vertical line extends from approximately 0 to 4500.
* **Median:** The horizontal line is positioned very low, likely below 200, indicating that the median citation count for this group is quite small.
* **ToT Papers (Right, Blue):**
* **Trend:** The distribution is much broader and extends significantly higher up the Y-axis compared to the Non-ToT group. The "belly" of the violin is wider and positioned higher.
* **Range:** The vertical line extends from near 0 up to nearly 7000.
* **Median:** The horizontal line is positioned significantly higher than the Non-ToT group, appearing to be approximately 1200–1300.
### Key Observations
* **Distribution Shift:** There is a clear upward shift in the ToT distribution. While both groups have a density peak near 0, the ToT group maintains a much thicker "body" as it moves up the Y-axis.
* **Outlier/Max Range:** The maximum citation count for ToT papers (approaching 7000) is notably higher than the maximum for Non-ToT papers (approximately 4500).
* **Variance:** The ToT group shows higher variance in citation counts, as evidenced by the wider violin shape and the extended range of the vertical line.
### Interpretation
The data suggests a strong positive correlation between the "ToT" (Tree of Thoughts) methodology and citation counts.
* **Impact:** Papers utilizing the ToT framework appear to be significantly more impactful or highly cited than those that do not.
* **Distributional Difference:** The Non-ToT group follows a "long tail" distribution where the vast majority of papers receive very few citations. In contrast, the ToT group, while still having a lower tail, demonstrates a much higher probability of achieving moderate to high citation counts.
* **Inference:** This could imply that the ToT methodology is either inherently more influential, attracts more attention within the research community, or is published in higher-impact venues compared to the Non-ToT baseline. The visual evidence strongly supports the conclusion that "ToT" papers outperform "Non-ToT" papers in terms of citation metrics.