\n
## Violin Plot: CausalCite Distribution for Non-ToT and ToT Papers
### Overview
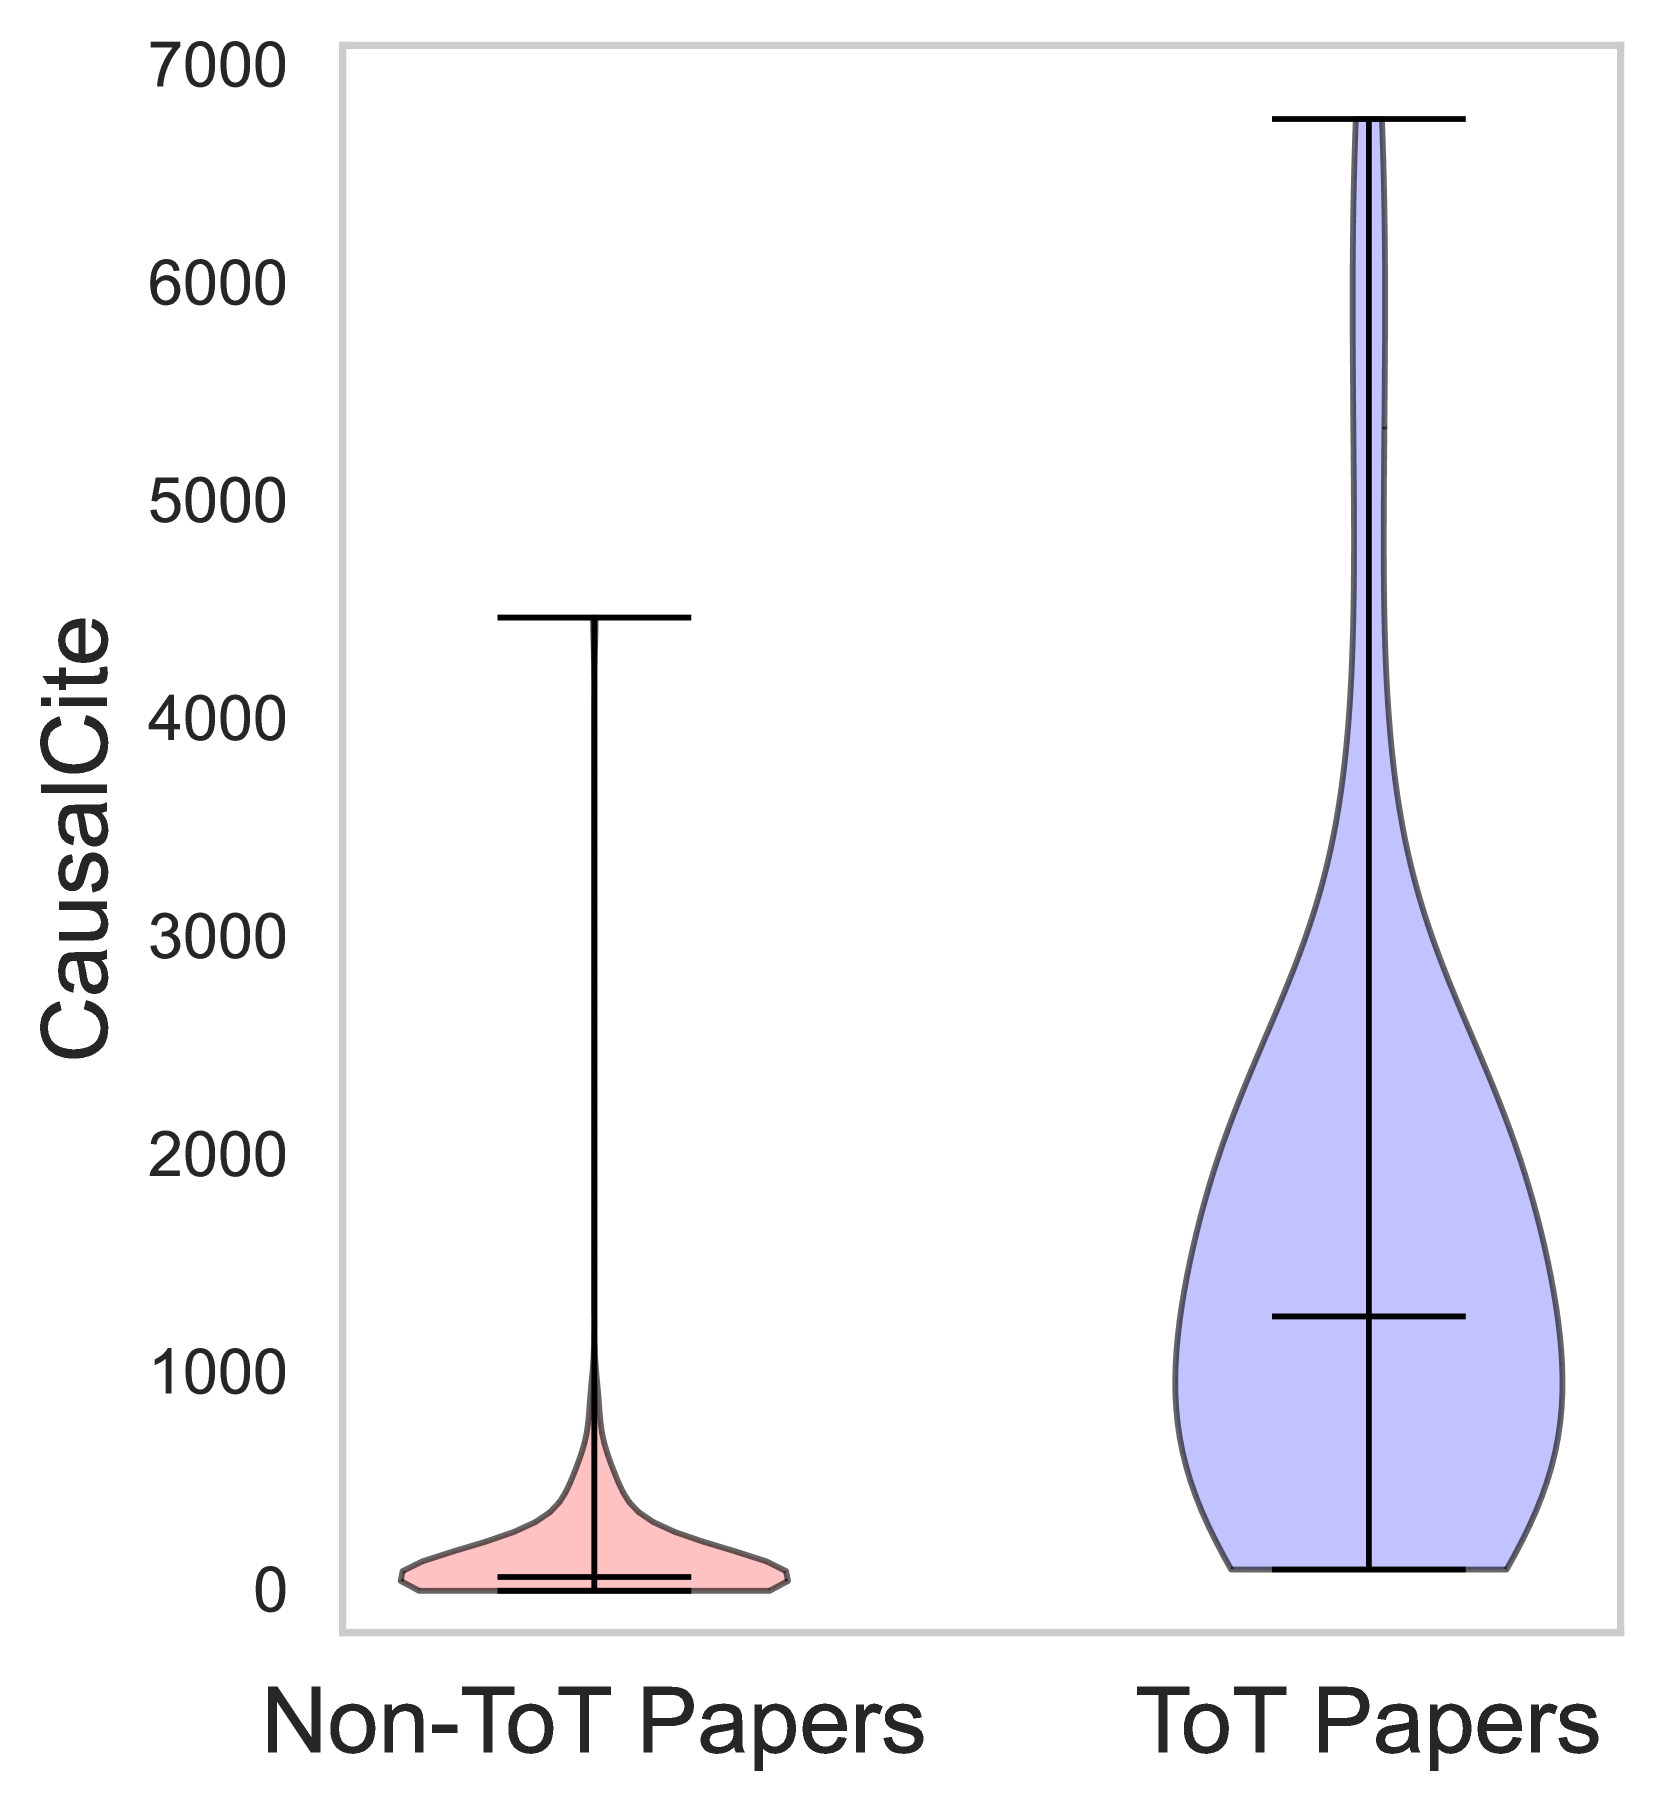
The image presents a violin plot comparing the distribution of "CausalCite" values for two categories of papers: "Non-ToT Papers" and "ToT Papers". The plot displays the density and range of CausalCite scores for each category, with a black line indicating the median and a black box representing the interquartile range (IQR).
### Components/Axes
* **X-axis:** Categorical variable representing the paper type. Labels are "Non-ToT Papers" and "ToT Papers".
* **Y-axis:** Numerical variable labeled "CausalCite", with a scale ranging from 0 to 7000.
* **Violin Shapes:** Two violin shapes, one in light red (Non-ToT Papers) and one in light blue (ToT Papers), representing the distribution of CausalCite values.
* **Median Lines:** Black lines within each violin plot indicating the median CausalCite value.
* **IQR Boxes:** Black boxes within each violin plot representing the interquartile range (IQR).
* **Whiskers:** Black lines extending from the boxes, indicating the range of the data.
### Detailed Analysis
**Non-ToT Papers (Light Red Violin):**
The violin shape is narrow, indicating a less dispersed distribution. The median line is positioned at approximately 300. The IQR box spans roughly from 150 to 500. The whiskers extend to approximately 800. The distribution appears skewed to the right, with a longer tail extending towards higher CausalCite values.
**ToT Papers (Light Blue Violin):**
The violin shape is wider, indicating a more dispersed distribution. The median line is positioned at approximately 1200. The IQR box spans roughly from 800 to 1600. The whiskers extend to approximately 6400. The distribution appears relatively symmetrical, with tails extending towards both lower and higher CausalCite values.
### Key Observations
* The distribution of CausalCite values for ToT Papers is significantly wider than for Non-ToT Papers.
* The median CausalCite value is substantially higher for ToT Papers (approximately 1200) compared to Non-ToT Papers (approximately 300).
* The maximum observed CausalCite value is much higher for ToT Papers (approximately 6400) than for Non-ToT Papers (approximately 800).
* The Non-ToT papers have a more concentrated distribution around lower CausalCite values.
### Interpretation
The data suggests that papers categorized as "ToT Papers" (likely "Theory of Mind" papers, based on the abbreviation) tend to have higher CausalCite scores than papers categorized as "Non-ToT Papers". The wider distribution of CausalCite values for ToT Papers indicates greater variability in the causal reasoning reflected in these papers. The higher median and maximum values suggest that ToT Papers, on average, demonstrate stronger causal reasoning or are cited more frequently in contexts related to causal inference. The difference in distributions could indicate that causal reasoning is a more prominent feature or is evaluated more rigorously in ToT Papers compared to Non-ToT Papers. The skewness of the Non-ToT distribution suggests that while most papers have low CausalCite scores, a small number exhibit relatively high scores.