## Violin Plot: CausalCite Distribution by Paper Type
### Overview
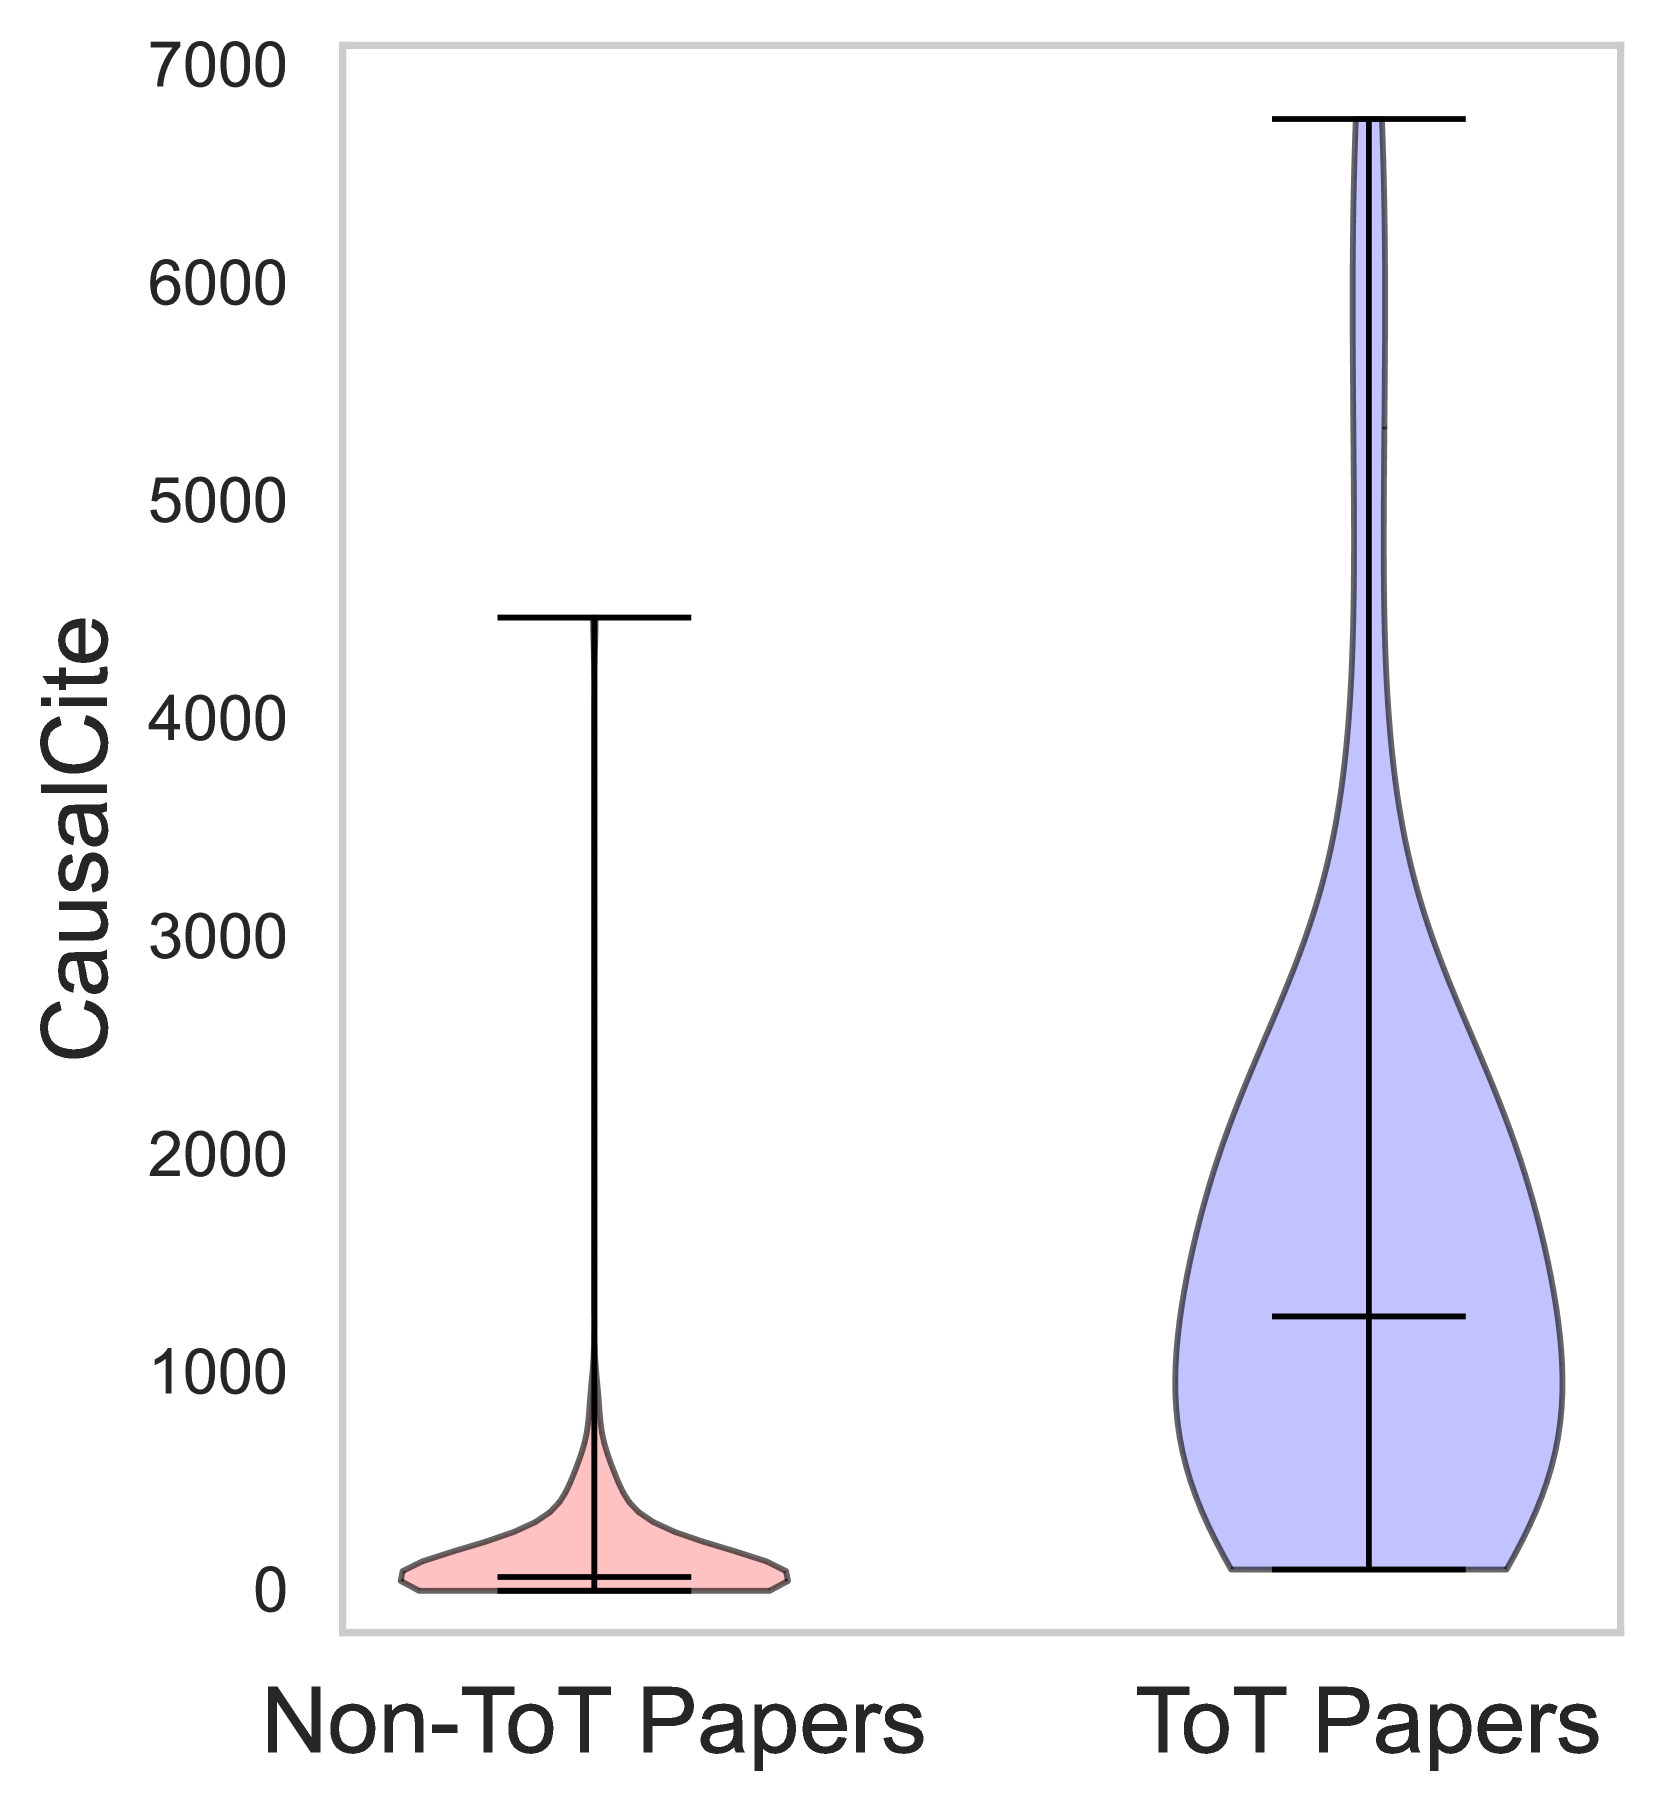
The image is a violin plot comparing the distribution of "CausalCite" scores for two categories: "Non-ToT Papers" (pink) and "ToT Papers" (purple). The y-axis represents "CausalCite" values ranging from 0 to 7000, while the x-axis categorizes the data into the two paper types. The plot uses violin shapes to visualize the density and spread of data points, with black lines indicating medians and whiskers showing the range.
### Components/Axes
- **X-axis**: Labeled "Non-ToT Papers" (left) and "ToT Papers" (right).
- **Y-axis**: Labeled "CausalCite" with a scale from 0 to 7000, marked at intervals of 1000.
- **Legend**: Located on the right side of the plot, associating pink with "Non-ToT Papers" and purple with "ToT Papers."
- **Violin Shapes**:
- **Non-ToT Papers**: A narrow, low-density violin with a peak near 1000 and a range from 0 to ~4500.
- **ToT Papers**: A wider, higher-density violin with a peak near 1500 and a range from 0 to ~7000.
- **Median Lines**: Horizontal black lines within each violin, at ~1000 (Non-ToT) and ~1500 (ToT).
- **Whiskers**: Vertical lines extending from the median to the minimum and maximum values.
### Detailed Analysis
- **Non-ToT Papers**:
- **Peak Density**: ~1000 (median).
- **Range**: 0 to ~4500 (whiskers).
- **Distribution**: Narrow and skewed, with most data concentrated near the median.
- **ToT Papers**:
- **Peak Density**: ~1500 (median).
- **Range**: 0 to ~7000 (whiskers).
- **Distribution**: Broader and more variable, with a higher density around the median but extending to the maximum y-axis value.
### Key Observations
1. **Higher CausalCite for ToT Papers**: The median for ToT Papers (~1500) is significantly higher than for Non-ToT Papers (~1000).
2. **Wider Distribution for ToT Papers**: The violin for ToT Papers spans the full y-axis range (0–7000), indicating greater variability in CausalCite scores.
3. **Lower Variability for Non-ToT Papers**: The Non-ToT violin is tightly clustered, suggesting more consistent CausalCite values.
4. **Outlier Potential**: The ToT Papers’ distribution extends to the maximum y-axis value (7000), which may represent extreme cases or outliers.
### Interpretation
The data suggests that "ToT Papers" are associated with higher CausalCite scores on average, potentially indicating greater impact, relevance, or methodological rigor compared to "Non-ToT Papers." The broader distribution of ToT Papers implies variability in their CausalCite values, which could stem from differences in research contexts, methodologies, or citation practices. In contrast, Non-ToT Papers exhibit more uniform CausalCite scores, possibly reflecting a more standardized or less impactful category. The presence of ToT Papers reaching the maximum y-axis value (7000) highlights the existence of high-impact outliers within this group. This visualization underscores the importance of paper type in determining CausalCite, with ToT Papers demonstrating both higher central tendency and greater diversity in their scores.