## Scatter Plot: Tourism Index vs. Tourism Value
### Overview
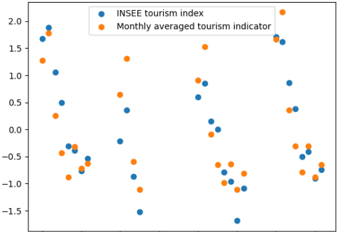
The image is a scatter plot comparing two tourism-related metrics: the "INSEE tourism index" (blue dots) and the "Monthly averaged tourism indicator" (orange dots). The plot uses a Cartesian coordinate system with numerical values on both axes. The legend is positioned in the top-right corner, and the data points are distributed across the plot with varying densities.
---
### Components/Axes
- **X-axis**: Labeled "Tourism Index" with values ranging from **0 to 6** (in increments of 1).
- **Y-axis**: Labeled "Tourism Value" with values ranging from **-1.5 to 2.0** (in increments of 0.5).
- **Legend**: Located in the **top-right corner**, with two entries:
- **Blue dots**: "INSEE tourism index"
- **Orange dots**: "Monthly averaged tourism indicator"
---
### Detailed Analysis
#### Data Series Trends
1. **INSEE Tourism Index (Blue Dots)**:
- **Distribution**: Clustered primarily in the **lower-left quadrant** (x ≈ 0–2, y ≈ -1.0 to 0.5).
- **Spread**: Some points extend to the upper-right quadrant (x ≈ 4–6, y ≈ 0.5–1.5).
- **Key Points**:
- Highest value: ~(0.5, 1.5)
- Lowest value: ~(1.0, -1.5)
- Dense cluster near (x ≈ 1–2, y ≈ -0.5 to 0.0).
2. **Monthly Averaged Tourism Indicator (Orange Dots)**:
- **Distribution**: More evenly spread across the plot, with a notable concentration in the **upper-right quadrant** (x ≈ 4–6, y ≈ 0.5–2.0).
- **Spread**: Points appear in all quadrants but are less dense in the lower-left.
- **Key Points**:
- Highest value: ~(5.5, 2.0)
- Lowest value: ~(1.5, -1.0)
- Dense cluster near (x ≈ 3–5, y ≈ 0.0–1.0).
#### Spatial Grounding
- **Legend**: Top-right corner, clearly distinguishing blue (INSEE) and orange (Monthly) data.
- **Data Points**: Blue dots dominate the lower-left, while orange dots are more dispersed, with a strong presence in the upper-right.
---
### Key Observations
1. **Clustering Differences**:
- The INSEE index shows a tighter clustering in the lower-left, suggesting lower variability in its values.
- The monthly indicator exhibits broader dispersion, indicating higher variability or sensitivity to external factors.
2. **Outliers**:
- No extreme outliers are visible, but the monthly indicator has a few points near the upper-right edge (y ≈ 2.0), suggesting potential peaks in tourism activity.
3. **Axis Ranges**:
- The y-axis spans a wider range (-1.5 to 2.0) compared to the x-axis (0–6), which may reflect differing scales of measurement for the two metrics.
---
### Interpretation
The plot suggests that the **INSEE tourism index** (blue) is more stable, with values concentrated around lower tourism levels, while the **monthly averaged tourism indicator** (orange) shows greater variability, with some instances of higher tourism activity. The spread of orange dots in the upper-right quadrant could indicate seasonal or event-driven spikes in tourism, whereas the blue dots’ clustering might reflect a more consistent, baseline measurement. The differing scales on the axes highlight potential methodological differences in how the two indices are calculated or reported.
**Note**: The image does not include explicit numerical labels for individual data points, so values are approximated based on visual positioning.