\n
## Line Chart: Convergence of Energy and Alpha
### Overview
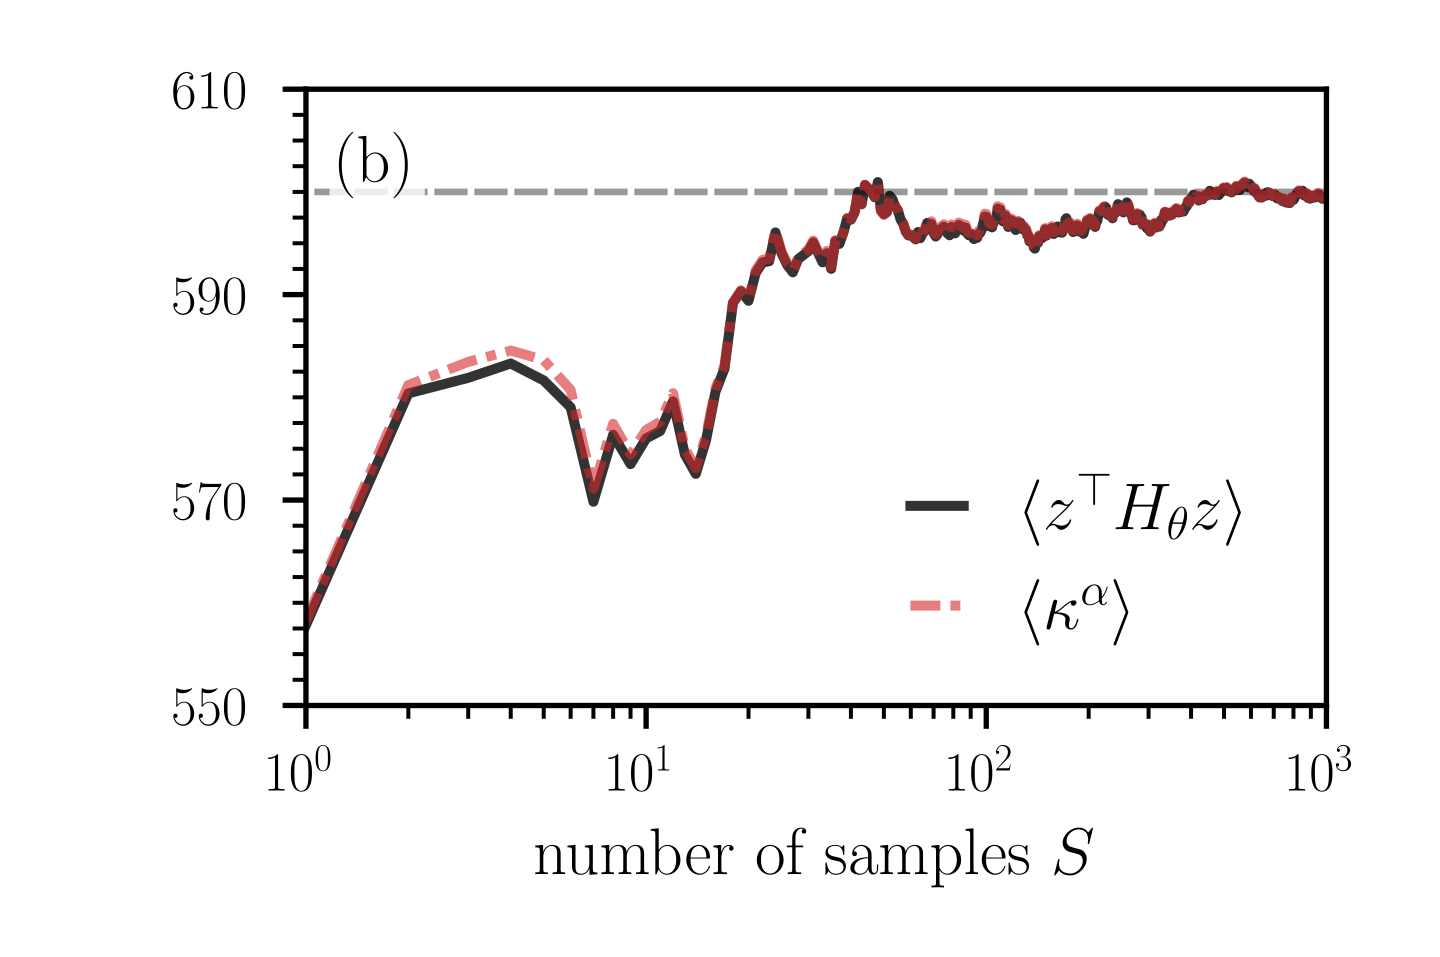
The image presents a line chart illustrating the convergence of two quantities, `<zᵀHθz>` and `<α>`, as a function of the number of samples, *S*. The chart appears to demonstrate how these values stabilize as more samples are used, potentially in a machine learning or statistical estimation context.
### Components/Axes
* **X-axis:** "number of samples *S*", with a logarithmic scale ranging from 10⁰ (1) to 10³ (1000). The axis markers are 1, 10, 100, 1000.
* **Y-axis:** Ranges from approximately 550 to 610, with markers at 550, 570, 590, and 610.
* **Legend:** Located in the top-right corner.
* `<zᵀHθz>`: Represented by a solid black line.
* `<α>`: Represented by a dashed red line.
* **Title:** "(b)" in the top-left corner. This suggests it is part of a larger figure.
### Detailed Analysis
* **`<zᵀHθz>` (Black Line):** The black line starts at approximately 560 at *S* = 1. It exhibits significant fluctuations initially, increasing to around 585 at *S* = 10. It continues to fluctuate, reaching a peak of approximately 598 at *S* = 50, then stabilizes around 595-600 for *S* values greater than 100.
* **`<α>` (Red Line):** The red dashed line begins at approximately 565 at *S* = 1. It also shows initial fluctuations, rising to around 590 at *S* = 10. It reaches a peak of approximately 599 at *S* = 50, and then stabilizes around 596-600 for *S* values greater than 100.
Here's a more detailed breakdown of approximate values:
| S | <zᵀHθz> | <α> |
| :----- | :------ | :----- |
| 1 | 560 | 565 |
| 10 | 585 | 590 |
| 50 | 598 | 599 |
| 100 | 596 | 597 |
| 1000 | 599 | 598 |
### Key Observations
* Both quantities, `<zᵀHθz>` and `<α>`, demonstrate a clear convergence trend as the number of samples *S* increases.
* The initial fluctuations are more pronounced for smaller values of *S*.
* The two lines are very close in value, especially for *S* > 100, suggesting a strong relationship between the two quantities.
* The convergence appears to be largely achieved by *S* = 100, with minimal changes observed beyond that point.
### Interpretation
The chart suggests that the quantities `<zᵀHθz>` and `<α>` are converging to stable values as the number of samples *S* increases. This is a common phenomenon in statistical estimation and machine learning, where increasing the amount of data leads to more accurate and reliable results. The close proximity of the two lines suggests that `<α>` might be a function or related to `<zᵀHθz>`. The initial fluctuations likely represent the variance in the estimates due to the limited number of samples. The stabilization around *S* = 100 indicates that this number of samples is sufficient to achieve a reasonable level of accuracy for these quantities. The "(b)" label suggests this is a component of a larger study, potentially comparing different methods or parameters. The logarithmic scale on the x-axis is used to effectively visualize the convergence behavior over a wide range of sample sizes.