## Line Graph: ⟨z†Hθz⟩ and ⟨κα⟩ vs. Number of Samples S
### Overview
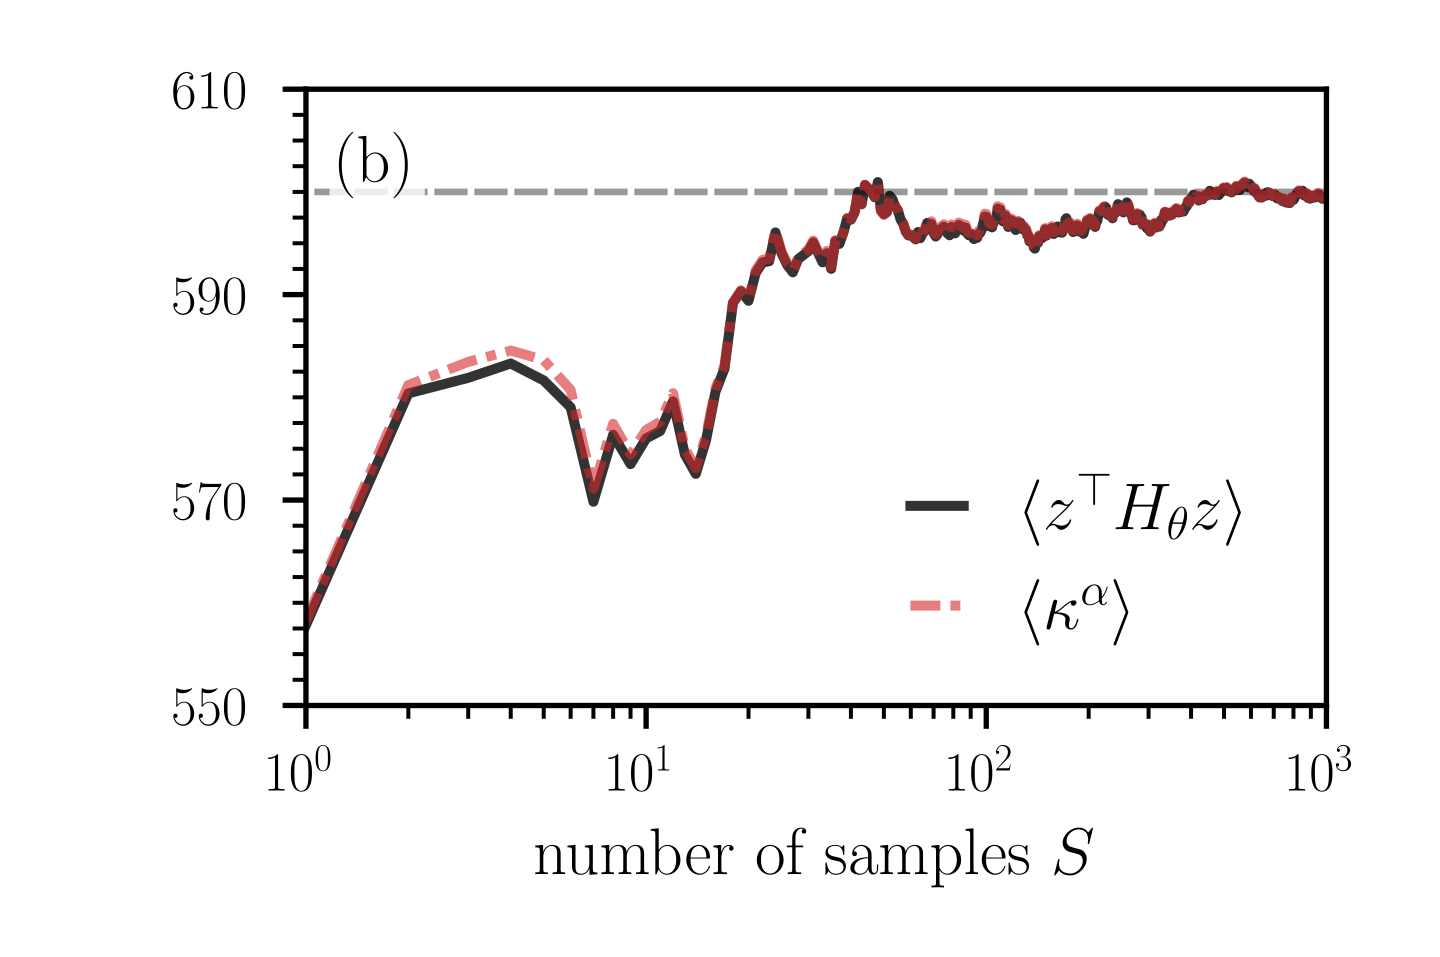
The graph depicts two data series plotted against a logarithmic scale of the number of samples (S) on the x-axis and a linear scale of values (550–610) on the y-axis. The black solid line represents ⟨z†Hθz⟩, while the dashed red line represents ⟨κα⟩. A horizontal dashed gray line at y=590 is labeled (b). Both series exhibit increasing trends with larger S, though ⟨z†Hθz⟩ consistently remains higher than ⟨κα⟩.
### Components/Axes
- **X-axis**: "number of samples S" (logarithmic scale: 10⁰ to 10³).
- **Y-axis**: Values ranging from 550 to 610 (linear scale).
- **Legend**: Located on the right, with:
- Black solid line: ⟨z†Hθz⟩.
- Dashed red line: ⟨κα⟩.
- **Additional Element**: Dashed gray horizontal line at y=590, labeled (b) in the top-right corner.
### Detailed Analysis
1. **⟨z†Hθz⟩ (Black Solid Line)**:
- Starts at ~560 when S=10⁰.
- Peaks at ~585 when S=10¹.
- Fluctuates but trends upward, reaching ~595 at S=10² and stabilizing near 595 at S=10³.
- Shows minor oscillations but maintains a clear upward trajectory.
2. **⟨κα⟩ (Dashed Red Line)**:
- Begins at ~565 when S=10⁰.
- Peaks at ~580 when S=10¹.
- Fluctuates more prominently than ⟨z†Hθz⟩, reaching ~590 at S=10² and ~595 at S=10³.
- Exhibits sharper dips and rises compared to the black line.
3. **Dashed Gray Line (y=590)**:
- Acts as a reference threshold, intersecting both series at higher S values.
### Key Observations
- Both series increase with S, but ⟨z†Hθz⟩ remains consistently higher than ⟨κα⟩ across all S values.
- ⟨κα⟩ shows greater variability, with more pronounced fluctuations.
- The gray line at y=590 aligns with the asymptotic values of both series at S=10³.
- Diminishing returns are evident as both lines stabilize near 595 for S ≥ 10².
### Interpretation
The data suggests that ⟨z†Hθz⟩ and ⟨κα⟩ converge toward similar values as the number of samples increases, with ⟨z†Hθz⟩ maintaining a slight advantage. The stabilization near y=595 implies a saturation point or equilibrium state for large S. The gray reference line at 590 may indicate a critical threshold or target value in the system being modeled. The red line’s greater volatility could reflect higher sensitivity to sampling noise or experimental conditions. This convergence highlights the importance of sample size in stabilizing measurements, with practical implications for optimizing data collection efficiency.