## Line Chart: Win Rate by Category
### Overview
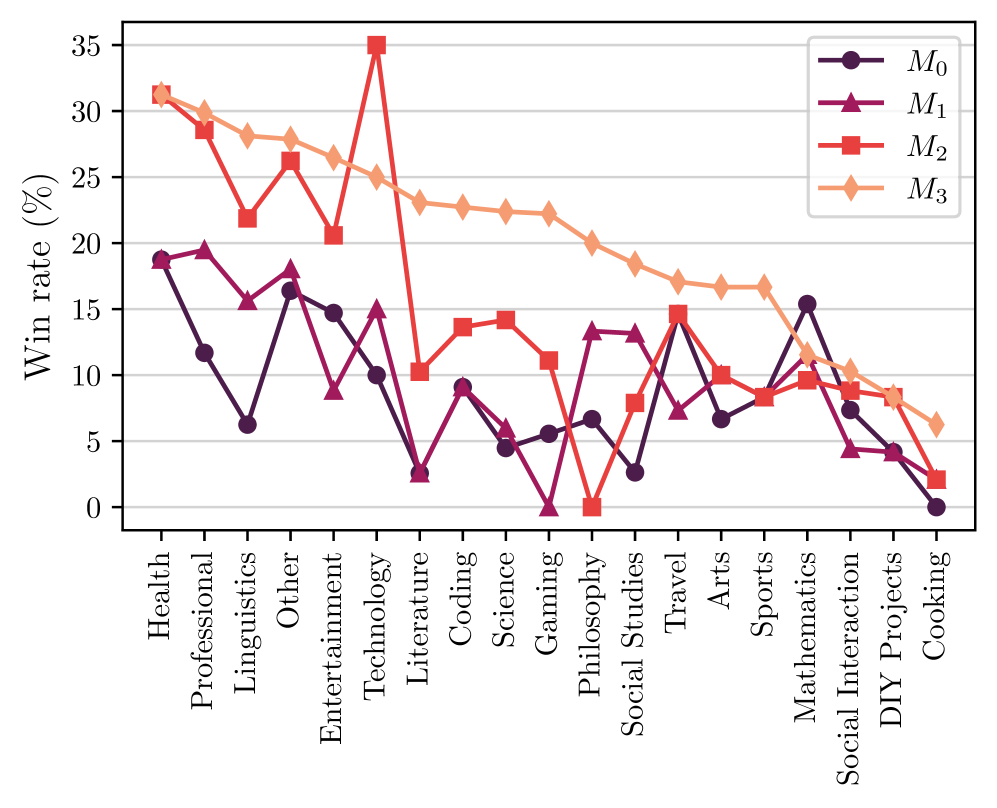
The image is a line chart comparing the win rates of four different models (M0, M1, M2, and M3) across various categories. The x-axis represents the categories, and the y-axis represents the win rate in percentage.
### Components/Axes
* **X-axis:** Categories: Health, Professional, Linguistics, Other, Entertainment, Technology, Literature, Coding, Science, Gaming, Philosophy, Social Studies, Travel, Arts, Sports, Mathematics, Social Interaction, DIY Projects, Cooking.
* **Y-axis:** Win rate (%), ranging from 0 to 35, with gridlines at intervals of 5.
* **Legend:** Located in the top-right corner.
* M0: Dark Purple line with circle markers.
* M1: Purple-Red line with triangle markers.
* M2: Red line with square markers.
* M3: Light Orange line with diamond markers.
### Detailed Analysis
Here's a breakdown of each model's performance across the categories:
* **M0 (Dark Purple, Circle Markers):**
* Trend: Generally decreasing win rate from left to right.
* Health: ~19%
* Professional: ~12%
* Linguistics: ~6%
* Other: ~18%
* Entertainment: ~15%
* Technology: ~3%
* Literature: ~9%
* Coding: ~5%
* Science: ~7%
* Gaming: ~0%
* Philosophy: ~3%
* Social Studies: ~15%
* Travel: ~7%
* Arts: ~7%
* Sports: ~8%
* Mathematics: ~16%
* Social Interaction: ~4%
* DIY Projects: ~0%
* Cooking: ~0%
* **M1 (Purple-Red, Triangle Markers):**
* Trend: Fluctuating win rate with no clear overall trend.
* Health: ~19%
* Professional: ~20%
* Linguistics: ~16%
* Other: ~18%
* Entertainment: ~9%
* Technology: ~15%
* Literature: ~3%
* Coding: ~14%
* Science: ~14%
* Gaming: ~5%
* Philosophy: ~0%
* Social Studies: ~13%
* Travel: ~3%
* Arts: ~15%
* Sports: ~10%
* Mathematics: ~9%
* Social Interaction: ~10%
* DIY Projects: ~4%
* Cooking: ~1%
* **M2 (Red, Square Markers):**
* Trend: Highly variable win rate with a significant spike in "Literature".
* Health: ~32%
* Professional: ~29%
* Linguistics: ~22%
* Other: ~27%
* Entertainment: ~21%
* Technology: ~10%
* Literature: ~35%
* Coding: ~11%
* Science: ~14%
* Gaming: ~11%
* Philosophy: ~0%
* Social Studies: ~14%
* Travel: ~15%
* Arts: ~10%
* Sports: ~9%
* Mathematics: ~11%
* Social Interaction: ~8%
* DIY Projects: ~7%
* Cooking: ~0%
* **M3 (Light Orange, Diamond Markers):**
* Trend: Generally decreasing win rate from left to right.
* Health: ~31%
* Professional: ~29%
* Linguistics: ~28%
* Other: ~27%
* Entertainment: ~27%
* Technology: ~25%
* Literature: ~23%
* Coding: ~23%
* Science: ~22%
* Gaming: ~22%
* Philosophy: ~22%
* Social Studies: ~20%
* Travel: ~18%
* Arts: ~17%
* Sports: ~17%
* Mathematics: ~11%
* Social Interaction: ~11%
* DIY Projects: ~8%
* Cooking: ~6%
### Key Observations
* M3 consistently has a high win rate across most categories, especially at the beginning.
* M2 has a very high win rate in "Literature" compared to other categories and models.
* M0 and M1 have lower win rates overall compared to M2 and M3.
* All models have very low win rates in "Gaming", "Philosophy", "DIY Projects", and "Cooking".
### Interpretation
The chart illustrates the performance of four different models across a range of categories. M3 appears to be the most consistently successful model, while M2 shows a strong affinity for the "Literature" category. The models struggle in categories like "Gaming", "Philosophy", "DIY Projects", and "Cooking", suggesting these categories may be more challenging or require different approaches. The data suggests that the choice of model can significantly impact the win rate depending on the specific category.