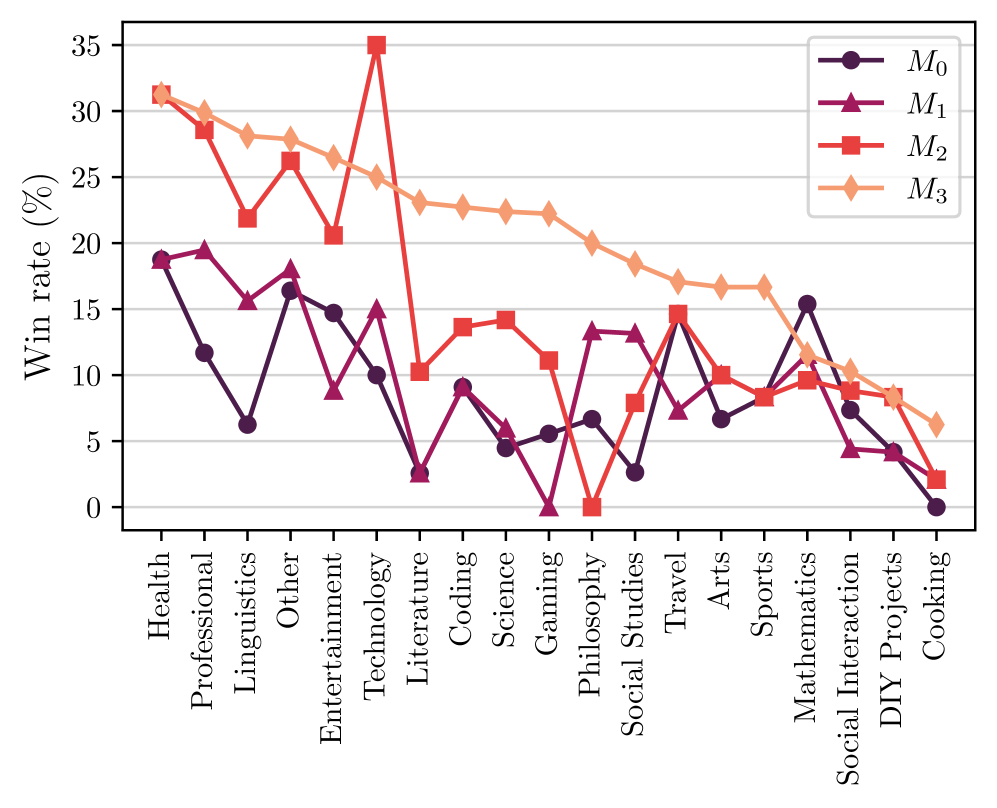
# Technical Data Extraction: Win Rate Comparison by Category
## 1. Metadata and Structure
* **Chart Type:** Multi-series Line Graph with markers.
* **Y-Axis Label:** Win rate (%)
* **Y-Axis Scale:** 0 to 35, with major gridlines every 5 units.
* **X-Axis Categories:** 20 distinct subject categories (listed from left to right).
* **Legend Location:** Top right [x=0.85, y=0.15 relative to chart area].
## 2. Legend and Series Identification
The chart compares four models ($M_0$ through $M_3$), each represented by a specific color and marker shape:
* **$M_0$ (Dark Purple, Circle marker):** Generally exhibits the lowest or second-lowest win rates across most categories, with high volatility.
* **$M_1$ (Maroon/Magenta, Triangle marker):** Shows erratic performance, often fluctuating between $M_0$ and $M_2$ levels.
* **$M_2$ (Red, Square marker):** Generally maintains a mid-to-high performance level, with a significant peak in "Technology."
* **$M_3$ (Light Orange/Peach, Diamond marker):** Exhibits the most stable and generally highest performance, following a consistent downward trend from left to right.
## 3. Data Table Extraction (Estimated Values)
The following table reconstructs the data points based on visual alignment with the Y-axis grid.
| Category | $M_0$ (Circle) | $M_1$ (Triangle) | $M_2$ (Square) | $M_3$ (Diamond) |
| :--- | :---: | :---: | :---: | :---: |
| **Health** | 18.5 | 18.5 | 31.5 | 31.5 |
| **Professional** | 11.5 | 19.5 | 28.5 | 30.0 |
| **Linguistics** | 6.5 | 15.5 | 22.0 | 28.0 |
| **Other** | 16.5 | 18.0 | 26.5 | 28.0 |
| **Entertainment** | 14.5 | 9.0 | 20.5 | 26.5 |
| **Technology** | 10.0 | 15.0 | 35.0 | 25.0 |
| **Literature** | 2.5 | 2.5 | 10.5 | 23.0 |
| **Coding** | 9.0 | 9.0 | 13.5 | 22.5 |
| **Science** | 4.5 | 6.0 | 14.0 | 22.5 |
| **Gaming** | 5.5 | 0.0 | 11.0 | 22.0 |
| **Philosophy** | 6.5 | 13.5 | 0.0 | 20.0 |
| **Social Studies** | 2.5 | 13.0 | 8.0 | 18.5 |
| **Travel** | 14.5 | 7.5 | 14.5 | 17.0 |
| **Arts** | 6.5 | 10.0 | 10.0 | 16.5 |
| **Sports** | 8.5 | 8.5 | 8.5 | 16.5 |
| **Mathematics** | 15.5 | 10.0 | 9.5 | 11.5 |
| **Social Interaction** | 7.5 | 4.5 | 9.0 | 10.5 |
| **DIY Projects** | 4.0 | 4.0 | 8.5 | 8.5 |
| **Cooking** | 0.0 | 2.0 | 2.0 | 6.5 |
## 4. Trend Analysis and Observations
* **Global Trend:** There is a general downward trend in win rates for all models as the categories move from "Health" (left) toward "Cooking" (right).
* **$M_3$ Dominance:** $M_3$ is the top performer in 17 out of 20 categories. It shows a very smooth, linear-like degradation in performance across the X-axis.
* **$M_2$ Anomaly:** $M_2$ reaches the absolute highest win rate of the entire dataset (~35%) in the "Technology" category, significantly outperforming $M_3$ in that specific niche.
* **Critical Failures:**
* $M_1$ drops to 0% in "Gaming."
* $M_2$ drops to 0% in "Philosophy."
* $M_0$ drops to 0% in "Cooking."
* **Convergence:** Performance across all models converges toward the lower end of the scale (0-10%) in the final four categories (Social Interaction, DIY Projects, Cooking).