\n
## Line Chart: Win Rate by Category
### Overview
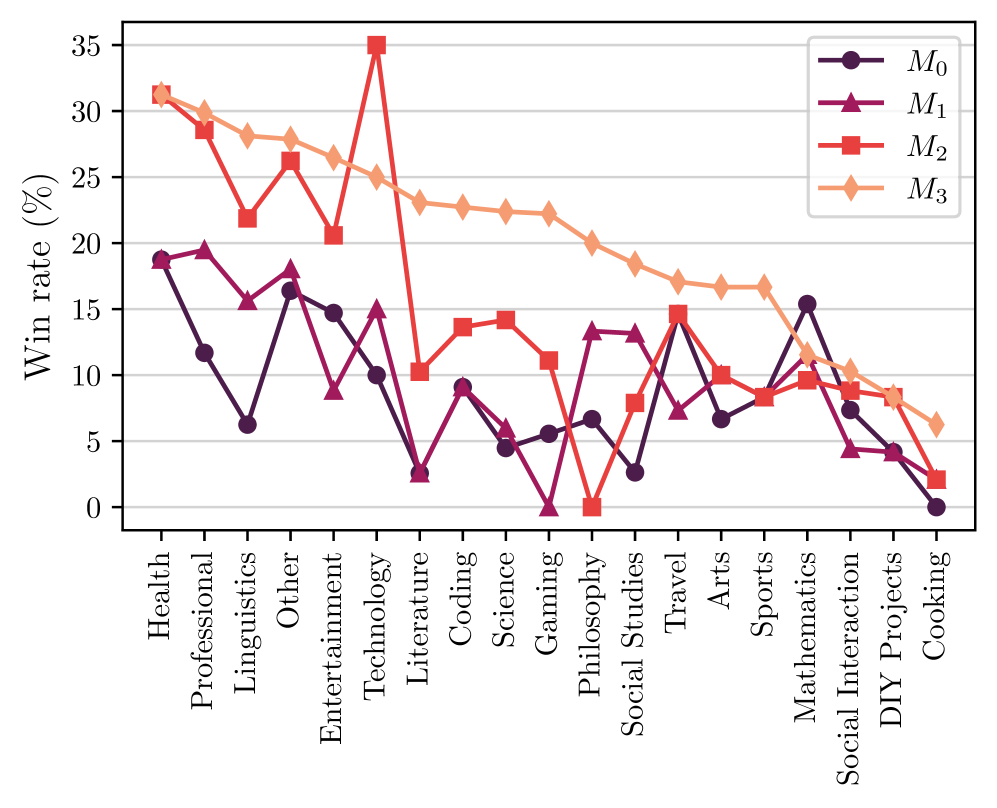
This image presents a line chart illustrating the win rate (in percentage) across various categories. Four distinct data series, labeled M₀, M₁, M₂, and M₃, are plotted against a categorical x-axis representing different fields of interest. The chart aims to compare the win rates of these series across these categories.
### Components/Axes
* **X-axis:** Categories - Health, Professional, Linguistics, Other, Entertainment, Technology, Literature, Coding, Science, Gaming, Philosophy, Social Studies, Travel, Arts, Sports, Mathematics, Social Interaction, DIY Projects, Cooking.
* **Y-axis:** Win Rate (%) - Scale ranges from approximately 0% to 35%.
* **Legend:** Located in the top-right corner.
* M₀ (Dark Blue)
* M₁ (Red)
* M₂ (Orange)
* M₃ (Light Orange)
### Detailed Analysis
The chart displays the win rate for each category and each model (M₀, M₁, M₂, M₃).
* **M₀ (Dark Blue):** This line generally fluctuates between approximately 5% and 25%. It starts at around 17% for Health, dips to approximately 8% for Professional, rises to around 22% for Linguistics, then decreases to around 10% for Other. It then rises to a peak of approximately 25% for Entertainment, drops to around 5% for Coding, and then fluctuates between 5% and 15% for the remaining categories, ending at approximately 7% for Cooking.
* **M₁ (Red):** This line exhibits a more dramatic fluctuation. It begins at approximately 15% for Health, rises sharply to a peak of around 30% for Professional, then declines rapidly to approximately 0% for Coding. It then rises again to around 10% for Philosophy, and then fluctuates between 0% and 10% for the remaining categories, ending at approximately 2% for Cooking.
* **M₂ (Orange):** This line shows a relatively stable trend, generally staying between approximately 20% and 30%. It starts at around 28% for Health, decreases to approximately 22% for Professional, then remains relatively stable around 25% for Linguistics, Other, Entertainment, and Technology. It then declines to around 20% for Literature, Coding, and Science, and then remains relatively stable around 18% to 22% for the remaining categories, ending at approximately 18% for Cooking.
* **M₃ (Light Orange):** This line starts at approximately 25% for Health, decreases to around 20% for Professional, then remains relatively stable around 22% to 25% for Linguistics, Other, Entertainment, Technology, Literature, Coding, Science, Gaming, Philosophy, Social Studies, Travel, Arts, Sports, Mathematics, Social Interaction, and DIY Projects, ending at approximately 20% for Cooking.
**Approximate Data Points (Read from the chart):**
| Category | M₀ (%) | M₁ (%) | M₂ (%) | M₃ (%) |
|-------------------|--------|--------|--------|--------|
| Health | 17 | 15 | 28 | 25 |
| Professional | 8 | 30 | 22 | 20 |
| Linguistics | 22 | 20 | 25 | 23 |
| Other | 10 | 18 | 25 | 24 |
| Entertainment | 25 | 15 | 25 | 24 |
| Technology | 22 | 12 | 25 | 24 |
| Literature | 15 | 10 | 20 | 22 |
| Coding | 5 | 0 | 20 | 22 |
| Science | 10 | 5 | 18 | 21 |
| Gaming | 8 | 8 | 20 | 21 |
| Philosophy | 12 | 10 | 18 | 20 |
| Social Studies | 15 | 8 | 18 | 20 |
| Travel | 14 | 10 | 18 | 20 |
| Arts | 10 | 8 | 18 | 19 |
| Sports | 12 | 8 | 18 | 19 |
| Mathematics | 10 | 8 | 18 | 19 |
| Social Interaction| 8 | 5 | 18 | 18 |
| DIY Projects | 10 | 5 | 18 | 18 |
| Cooking | 7 | 2 | 18 | 20 |
### Key Observations
* M₁ exhibits the most volatile win rate, with significant peaks and troughs.
* M₂ and M₃ demonstrate relatively stable win rates across most categories.
* M₀ shows moderate fluctuations, generally staying within a narrower range than M₁.
* The highest win rates for M₁ are observed in the "Professional" category.
* The lowest win rates for M₁ are observed in the "Coding" category.
* The win rates for M₂ and M₃ are consistently higher than those of M₀ and M₁ across most categories.
### Interpretation
The chart suggests that the performance of the models (M₀, M₁, M₂, M₃) varies significantly depending on the category. Model M₁ appears to be highly specialized, excelling in "Professional" fields but performing poorly in "Coding." Models M₂ and M₃ demonstrate more consistent performance across all categories, indicating a broader range of capabilities. The differences in win rates between the models could be attributed to variations in their training data, algorithms, or underlying architectures. The chart highlights the importance of considering category-specific performance when evaluating and selecting models for different tasks. The consistent performance of M₂ and M₃ might make them preferable for applications requiring reliable performance across a wide range of domains, while M₁ could be a valuable asset in specialized areas like "Professional" fields. The data suggests that the models are not universally superior in all areas, and their effectiveness is contingent upon the specific context.